Comanche vs Slavic Unemployment
COMPARE
Comanche
Slavic
Unemployment
Unemployment Comparison
Comanche
Slavs
5.5%
UNEMPLOYMENT
4.9/ 100
METRIC RATING
232nd/ 347
METRIC RANK
4.9%
UNEMPLOYMENT
98.6/ 100
METRIC RATING
68th/ 347
METRIC RANK
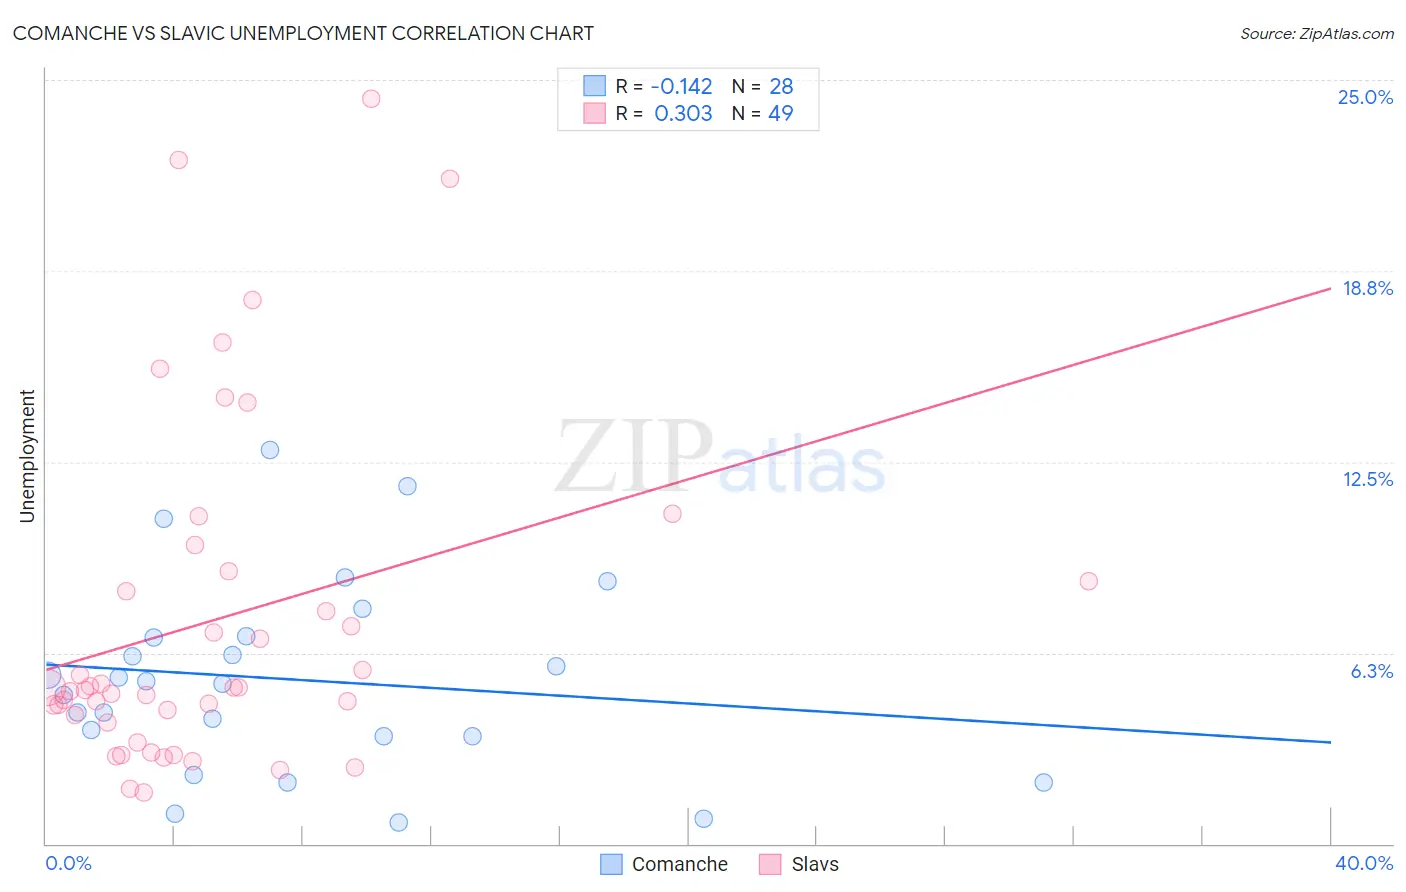
Comanche vs Slavic Unemployment Correlation Chart
The statistical analysis conducted on geographies consisting of 109,712,391 people shows a poor negative correlation between the proportion of Comanche and unemployment in the United States with a correlation coefficient (R) of -0.142 and weighted average of 5.5%. Similarly, the statistical analysis conducted on geographies consisting of 270,672,053 people shows a mild positive correlation between the proportion of Slavs and unemployment in the United States with a correlation coefficient (R) of 0.303 and weighted average of 4.9%, a difference of 11.9%.
Unemployment Correlation Summary
| Measurement | Comanche | Slavic |
| Minimum | 0.70% | 1.7% |
| Maximum | 12.9% | 24.4% |
| Range | 12.2% | 22.7% |
| Mean | 5.4% | 7.3% |
| Median | 5.3% | 5.1% |
| Interquartile 25% (IQ1) | 3.5% | 4.1% |
| Interquartile 75% (IQ3) | 6.8% | 8.7% |
| Interquartile Range (IQR) | 3.3% | 4.7% |
| Standard Deviation (Sample) | 3.1% | 5.6% |
| Standard Deviation (Population) | 3.1% | 5.5% |
Similar Demographics by Unemployment
Demographics Similar to Comanche by Unemployment
In terms of unemployment, the demographic groups most similar to Comanche are Immigrants from Africa (5.5%, a difference of 0.0%), Immigrants from Syria (5.5%, a difference of 0.050%), Panamanian (5.5%, a difference of 0.080%), Hawaiian (5.5%, a difference of 0.13%), and Ottawa (5.5%, a difference of 0.13%).
| Demographics | Rating | Rank | Unemployment |
| South American Indians | 7.8 /100 | #225 | Tragic 5.5% |
| Samoans | 7.1 /100 | #226 | Tragic 5.5% |
| Immigrants | Lebanon | 7.0 /100 | #227 | Tragic 5.5% |
| Guamanians/Chamorros | 6.3 /100 | #228 | Tragic 5.5% |
| Hawaiians | 5.4 /100 | #229 | Tragic 5.5% |
| Ottawa | 5.4 /100 | #230 | Tragic 5.5% |
| Immigrants | Africa | 4.9 /100 | #231 | Tragic 5.5% |
| Comanche | 4.9 /100 | #232 | Tragic 5.5% |
| Immigrants | Syria | 4.8 /100 | #233 | Tragic 5.5% |
| Panamanians | 4.7 /100 | #234 | Tragic 5.5% |
| Immigrants | Panama | 3.4 /100 | #235 | Tragic 5.5% |
| Immigrants | Cambodia | 3.3 /100 | #236 | Tragic 5.5% |
| Moroccans | 3.2 /100 | #237 | Tragic 5.5% |
| Immigrants | Western Asia | 2.8 /100 | #238 | Tragic 5.5% |
| Immigrants | Immigrants | 2.6 /100 | #239 | Tragic 5.5% |
Demographics Similar to Slavs by Unemployment
In terms of unemployment, the demographic groups most similar to Slavs are New Zealander (4.9%, a difference of 0.030%), Slovak (4.9%, a difference of 0.070%), Immigrants from North America (4.9%, a difference of 0.090%), Immigrants from Canada (4.9%, a difference of 0.22%), and Serbian (4.9%, a difference of 0.24%).
| Demographics | Rating | Rank | Unemployment |
| Cambodians | 99.0 /100 | #61 | Exceptional 4.9% |
| Icelanders | 98.9 /100 | #62 | Exceptional 4.9% |
| Immigrants | Bulgaria | 98.9 /100 | #63 | Exceptional 4.9% |
| Italians | 98.9 /100 | #64 | Exceptional 4.9% |
| Immigrants | Canada | 98.8 /100 | #65 | Exceptional 4.9% |
| Slovaks | 98.7 /100 | #66 | Exceptional 4.9% |
| New Zealanders | 98.6 /100 | #67 | Exceptional 4.9% |
| Slavs | 98.6 /100 | #68 | Exceptional 4.9% |
| Immigrants | North America | 98.5 /100 | #69 | Exceptional 4.9% |
| Serbians | 98.4 /100 | #70 | Exceptional 4.9% |
| Immigrants | Japan | 98.3 /100 | #71 | Exceptional 4.9% |
| Burmese | 98.3 /100 | #72 | Exceptional 4.9% |
| Paraguayans | 98.3 /100 | #73 | Exceptional 4.9% |
| Immigrants | Northern Europe | 98.2 /100 | #74 | Exceptional 4.9% |
| Turks | 98.0 /100 | #75 | Exceptional 4.9% |