Immigrants from Grenada vs Slavic Unemployment
COMPARE
Immigrants from Grenada
Slavic
Unemployment
Unemployment Comparison
Immigrants from Grenada
Slavs
6.9%
UNEMPLOYMENT
0.0/ 100
METRIC RATING
323rd/ 347
METRIC RANK
4.9%
UNEMPLOYMENT
98.6/ 100
METRIC RATING
68th/ 347
METRIC RANK
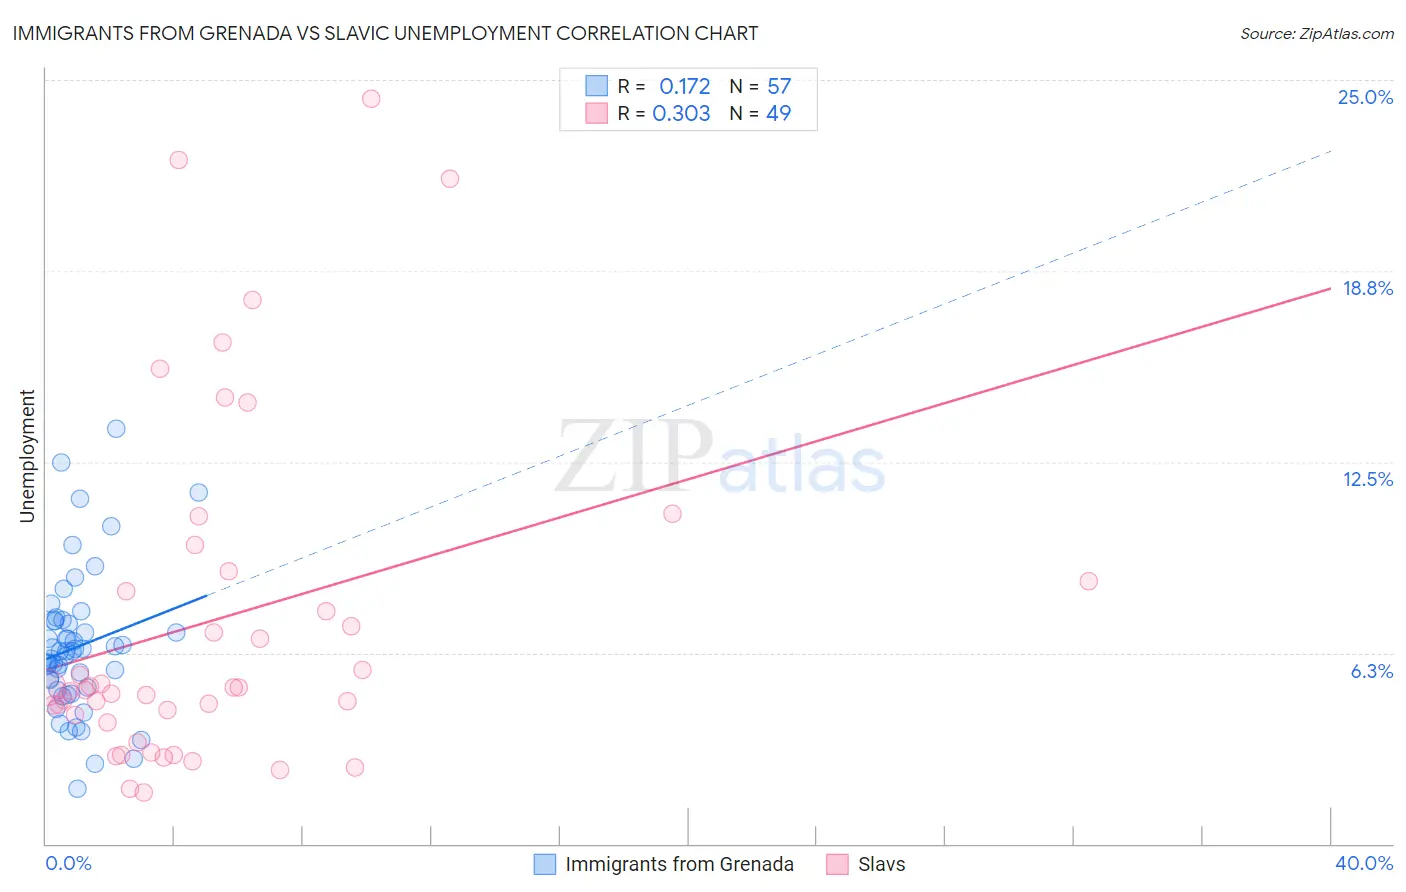
Immigrants from Grenada vs Slavic Unemployment Correlation Chart
The statistical analysis conducted on geographies consisting of 67,187,292 people shows a poor positive correlation between the proportion of Immigrants from Grenada and unemployment in the United States with a correlation coefficient (R) of 0.172 and weighted average of 6.9%. Similarly, the statistical analysis conducted on geographies consisting of 270,672,053 people shows a mild positive correlation between the proportion of Slavs and unemployment in the United States with a correlation coefficient (R) of 0.303 and weighted average of 4.9%, a difference of 40.7%.
Unemployment Correlation Summary
| Measurement | Immigrants from Grenada | Slavic |
| Minimum | 1.8% | 1.7% |
| Maximum | 13.6% | 24.4% |
| Range | 11.8% | 22.7% |
| Mean | 6.4% | 7.3% |
| Median | 6.3% | 5.1% |
| Interquartile 25% (IQ1) | 5.1% | 4.1% |
| Interquartile 75% (IQ3) | 7.3% | 8.7% |
| Interquartile Range (IQR) | 2.2% | 4.7% |
| Standard Deviation (Sample) | 2.3% | 5.6% |
| Standard Deviation (Population) | 2.3% | 5.5% |
Similar Demographics by Unemployment
Demographics Similar to Immigrants from Grenada by Unemployment
In terms of unemployment, the demographic groups most similar to Immigrants from Grenada are Guyanese (6.9%, a difference of 0.32%), Immigrants from Guyana (6.9%, a difference of 0.36%), Immigrants from St. Vincent and the Grenadines (6.9%, a difference of 0.37%), Immigrants from Armenia (7.0%, a difference of 1.2%), and British West Indian (6.8%, a difference of 1.2%).
| Demographics | Rating | Rank | Unemployment |
| Immigrants | Dominica | 0.0 /100 | #316 | Tragic 6.7% |
| Shoshone | 0.0 /100 | #317 | Tragic 6.8% |
| Immigrants | Cabo Verde | 0.0 /100 | #318 | Tragic 6.8% |
| British West Indians | 0.0 /100 | #319 | Tragic 6.8% |
| Immigrants | St. Vincent and the Grenadines | 0.0 /100 | #320 | Tragic 6.9% |
| Immigrants | Guyana | 0.0 /100 | #321 | Tragic 6.9% |
| Guyanese | 0.0 /100 | #322 | Tragic 6.9% |
| Immigrants | Grenada | 0.0 /100 | #323 | Tragic 6.9% |
| Immigrants | Armenia | 0.0 /100 | #324 | Tragic 7.0% |
| Natives/Alaskans | 0.0 /100 | #325 | Tragic 7.0% |
| Paiute | 0.0 /100 | #326 | Tragic 7.1% |
| Pueblo | 0.0 /100 | #327 | Tragic 7.2% |
| Tsimshian | 0.0 /100 | #328 | Tragic 7.2% |
| Alaska Natives | 0.0 /100 | #329 | Tragic 7.2% |
| Yakama | 0.0 /100 | #330 | Tragic 7.3% |
Demographics Similar to Slavs by Unemployment
In terms of unemployment, the demographic groups most similar to Slavs are New Zealander (4.9%, a difference of 0.030%), Slovak (4.9%, a difference of 0.070%), Immigrants from North America (4.9%, a difference of 0.090%), Immigrants from Canada (4.9%, a difference of 0.22%), and Serbian (4.9%, a difference of 0.24%).
| Demographics | Rating | Rank | Unemployment |
| Cambodians | 99.0 /100 | #61 | Exceptional 4.9% |
| Icelanders | 98.9 /100 | #62 | Exceptional 4.9% |
| Immigrants | Bulgaria | 98.9 /100 | #63 | Exceptional 4.9% |
| Italians | 98.9 /100 | #64 | Exceptional 4.9% |
| Immigrants | Canada | 98.8 /100 | #65 | Exceptional 4.9% |
| Slovaks | 98.7 /100 | #66 | Exceptional 4.9% |
| New Zealanders | 98.6 /100 | #67 | Exceptional 4.9% |
| Slavs | 98.6 /100 | #68 | Exceptional 4.9% |
| Immigrants | North America | 98.5 /100 | #69 | Exceptional 4.9% |
| Serbians | 98.4 /100 | #70 | Exceptional 4.9% |
| Immigrants | Japan | 98.3 /100 | #71 | Exceptional 4.9% |
| Burmese | 98.3 /100 | #72 | Exceptional 4.9% |
| Paraguayans | 98.3 /100 | #73 | Exceptional 4.9% |
| Immigrants | Northern Europe | 98.2 /100 | #74 | Exceptional 4.9% |
| Turks | 98.0 /100 | #75 | Exceptional 4.9% |