Immigrants from Scotland vs Slavic Unemployment
COMPARE
Immigrants from Scotland
Slavic
Unemployment
Unemployment Comparison
Immigrants from Scotland
Slavs
4.9%
UNEMPLOYMENT
99.3/ 100
METRIC RATING
48th/ 347
METRIC RANK
4.9%
UNEMPLOYMENT
98.6/ 100
METRIC RATING
68th/ 347
METRIC RANK
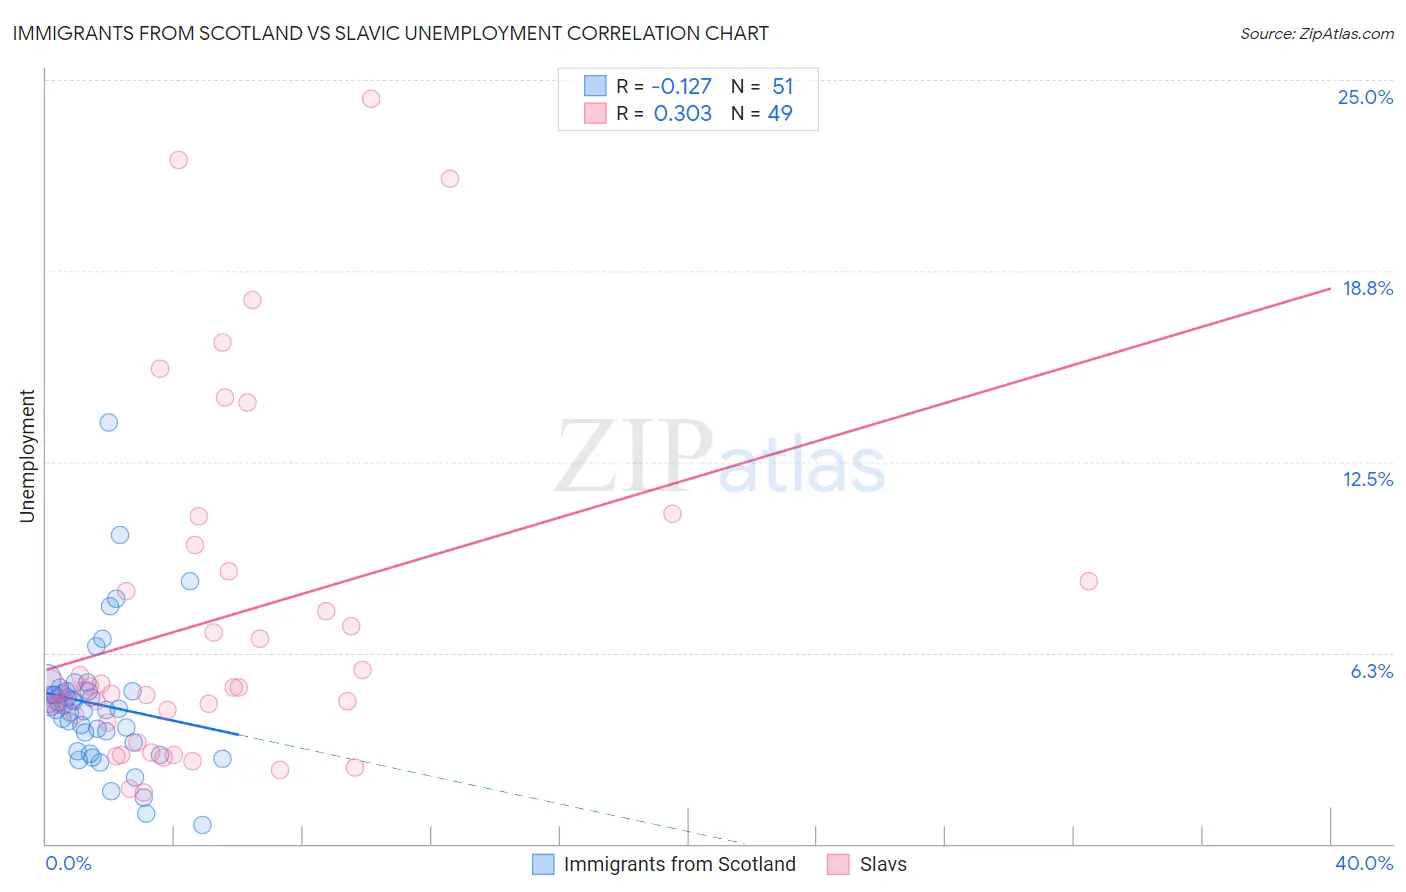
Immigrants from Scotland vs Slavic Unemployment Correlation Chart
The statistical analysis conducted on geographies consisting of 196,312,940 people shows a poor negative correlation between the proportion of Immigrants from Scotland and unemployment in the United States with a correlation coefficient (R) of -0.127 and weighted average of 4.9%. Similarly, the statistical analysis conducted on geographies consisting of 270,672,053 people shows a mild positive correlation between the proportion of Slavs and unemployment in the United States with a correlation coefficient (R) of 0.303 and weighted average of 4.9%, a difference of 1.2%.
Unemployment Correlation Summary
| Measurement | Immigrants from Scotland | Slavic |
| Minimum | 0.60% | 1.7% |
| Maximum | 13.8% | 24.4% |
| Range | 13.2% | 22.7% |
| Mean | 4.6% | 7.3% |
| Median | 4.5% | 5.1% |
| Interquartile 25% (IQ1) | 3.3% | 4.1% |
| Interquartile 75% (IQ3) | 5.0% | 8.7% |
| Interquartile Range (IQR) | 1.7% | 4.7% |
| Standard Deviation (Sample) | 2.2% | 5.6% |
| Standard Deviation (Population) | 2.2% | 5.5% |
Demographics Similar to Immigrants from Scotland and Slavs by Unemployment
In terms of unemployment, the demographic groups most similar to Immigrants from Scotland are Immigrants from South Central Asia (4.9%, a difference of 0.010%), French Canadian (4.9%, a difference of 0.030%), Immigrants from Belgium (4.9%, a difference of 0.19%), White/Caucasian (4.9%, a difference of 0.20%), and Immigrants from Zimbabwe (4.9%, a difference of 0.23%). Similarly, the demographic groups most similar to Slavs are New Zealander (4.9%, a difference of 0.030%), Slovak (4.9%, a difference of 0.070%), Immigrants from Canada (4.9%, a difference of 0.22%), Italian (4.9%, a difference of 0.36%), and Immigrants from Bulgaria (4.9%, a difference of 0.44%).
| Demographics | Rating | Rank | Unemployment |
| Immigrants | Scotland | 99.3 /100 | #48 | Exceptional 4.9% |
| Immigrants | South Central Asia | 99.3 /100 | #49 | Exceptional 4.9% |
| French Canadians | 99.3 /100 | #50 | Exceptional 4.9% |
| Immigrants | Belgium | 99.2 /100 | #51 | Exceptional 4.9% |
| Whites/Caucasians | 99.2 /100 | #52 | Exceptional 4.9% |
| Immigrants | Zimbabwe | 99.2 /100 | #53 | Exceptional 4.9% |
| Eastern Europeans | 99.2 /100 | #54 | Exceptional 4.9% |
| Australians | 99.2 /100 | #55 | Exceptional 4.9% |
| Celtics | 99.1 /100 | #56 | Exceptional 4.9% |
| Immigrants | Singapore | 99.1 /100 | #57 | Exceptional 4.9% |
| Greeks | 99.0 /100 | #58 | Exceptional 4.9% |
| Bhutanese | 99.0 /100 | #59 | Exceptional 4.9% |
| Immigrants | Netherlands | 99.0 /100 | #60 | Exceptional 4.9% |
| Cambodians | 99.0 /100 | #61 | Exceptional 4.9% |
| Icelanders | 98.9 /100 | #62 | Exceptional 4.9% |
| Immigrants | Bulgaria | 98.9 /100 | #63 | Exceptional 4.9% |
| Italians | 98.9 /100 | #64 | Exceptional 4.9% |
| Immigrants | Canada | 98.8 /100 | #65 | Exceptional 4.9% |
| Slovaks | 98.7 /100 | #66 | Exceptional 4.9% |
| New Zealanders | 98.6 /100 | #67 | Exceptional 4.9% |
| Slavs | 98.6 /100 | #68 | Exceptional 4.9% |