Immigrants from Belarus vs Slavic 2nd Grade
COMPARE
Immigrants from Belarus
Slavic
2nd Grade
2nd Grade Comparison
Immigrants from Belarus
Slavs
97.8%
2ND GRADE
41.5/ 100
METRIC RATING
184th/ 347
METRIC RANK
98.3%
2ND GRADE
99.8/ 100
METRIC RATING
59th/ 347
METRIC RANK
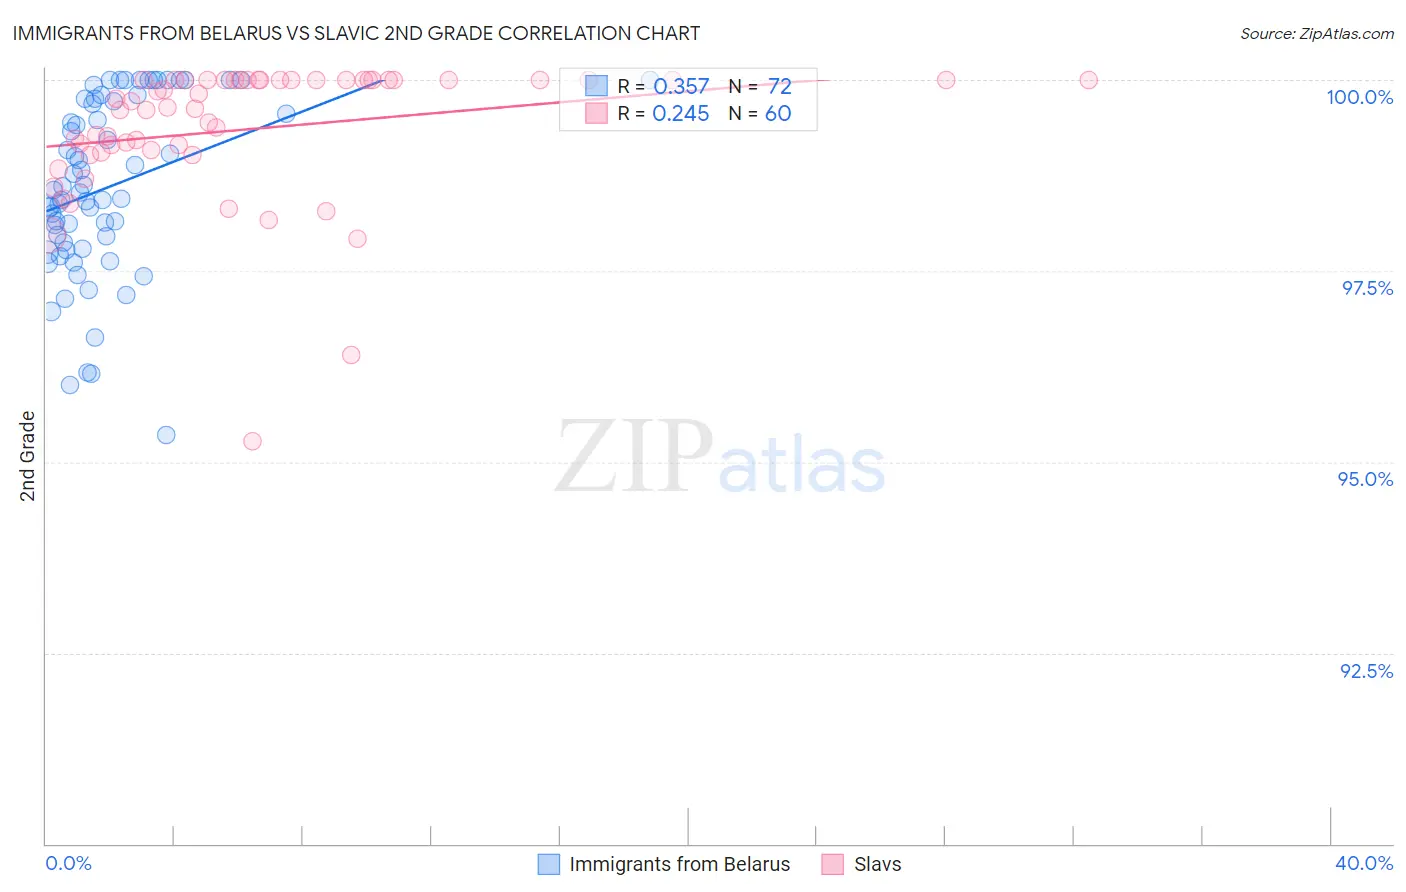
Immigrants from Belarus vs Slavic 2nd Grade Correlation Chart
The statistical analysis conducted on geographies consisting of 149,993,317 people shows a mild positive correlation between the proportion of Immigrants from Belarus and percentage of population with at least 2nd grade education in the United States with a correlation coefficient (R) of 0.357 and weighted average of 97.8%. Similarly, the statistical analysis conducted on geographies consisting of 270,869,056 people shows a weak positive correlation between the proportion of Slavs and percentage of population with at least 2nd grade education in the United States with a correlation coefficient (R) of 0.245 and weighted average of 98.3%, a difference of 0.50%.
2nd Grade Correlation Summary
| Measurement | Immigrants from Belarus | Slavic |
| Minimum | 95.4% | 95.3% |
| Maximum | 100.0% | 100.0% |
| Range | 4.6% | 4.7% |
| Mean | 98.6% | 99.4% |
| Median | 98.5% | 99.7% |
| Interquartile 25% (IQ1) | 97.8% | 99.1% |
| Interquartile 75% (IQ3) | 99.7% | 100.0% |
| Interquartile Range (IQR) | 1.9% | 0.93% |
| Standard Deviation (Sample) | 1.1% | 0.91% |
| Standard Deviation (Population) | 1.1% | 0.90% |
Similar Demographics by 2nd Grade
Demographics Similar to Immigrants from Belarus by 2nd Grade
In terms of 2nd grade, the demographic groups most similar to Immigrants from Belarus are Portuguese (97.8%, a difference of 0.0%), Immigrants from Poland (97.8%, a difference of 0.0%), Immigrants from Argentina (97.8%, a difference of 0.0%), Immigrants from Venezuela (97.9%, a difference of 0.010%), and Native/Alaskan (97.9%, a difference of 0.010%).
| Demographics | Rating | Rank | 2nd Grade |
| Immigrants | Brazil | 46.6 /100 | #177 | Average 97.9% |
| Argentineans | 46.3 /100 | #178 | Average 97.9% |
| Immigrants | Venezuela | 46.1 /100 | #179 | Average 97.9% |
| Natives/Alaskans | 44.3 /100 | #180 | Average 97.9% |
| Egyptians | 44.3 /100 | #181 | Average 97.9% |
| Portuguese | 42.4 /100 | #182 | Average 97.8% |
| Immigrants | Poland | 42.2 /100 | #183 | Average 97.8% |
| Immigrants | Belarus | 41.5 /100 | #184 | Average 97.8% |
| Immigrants | Argentina | 40.6 /100 | #185 | Average 97.8% |
| Arabs | 36.9 /100 | #186 | Fair 97.8% |
| Pakistanis | 36.1 /100 | #187 | Fair 97.8% |
| Immigrants | Kazakhstan | 35.6 /100 | #188 | Fair 97.8% |
| Panamanians | 33.5 /100 | #189 | Fair 97.8% |
| Immigrants | Taiwan | 31.8 /100 | #190 | Fair 97.8% |
| Paraguayans | 30.8 /100 | #191 | Fair 97.8% |
Demographics Similar to Slavs by 2nd Grade
In terms of 2nd grade, the demographic groups most similar to Slavs are Creek (98.3%, a difference of 0.0%), Immigrants from Canada (98.3%, a difference of 0.0%), Greek (98.3%, a difference of 0.0%), American (98.3%, a difference of 0.010%), and Austrian (98.3%, a difference of 0.010%).
| Demographics | Rating | Rank | 2nd Grade |
| Australians | 99.8 /100 | #52 | Exceptional 98.4% |
| Pueblo | 99.8 /100 | #53 | Exceptional 98.3% |
| Kiowa | 99.8 /100 | #54 | Exceptional 98.3% |
| Immigrants | Scotland | 99.8 /100 | #55 | Exceptional 98.3% |
| Americans | 99.8 /100 | #56 | Exceptional 98.3% |
| Austrians | 99.8 /100 | #57 | Exceptional 98.3% |
| Bulgarians | 99.8 /100 | #58 | Exceptional 98.3% |
| Slavs | 99.8 /100 | #59 | Exceptional 98.3% |
| Creek | 99.8 /100 | #60 | Exceptional 98.3% |
| Immigrants | Canada | 99.8 /100 | #61 | Exceptional 98.3% |
| Greeks | 99.8 /100 | #62 | Exceptional 98.3% |
| Maltese | 99.7 /100 | #63 | Exceptional 98.3% |
| Immigrants | North America | 99.7 /100 | #64 | Exceptional 98.3% |
| New Zealanders | 99.7 /100 | #65 | Exceptional 98.3% |
| Canadians | 99.7 /100 | #66 | Exceptional 98.3% |