Immigrants from Albania vs Sioux Seniors Poverty Over the Age of 65
COMPARE
Immigrants from Albania
Sioux
Seniors Poverty Over the Age of 65
Seniors Poverty Over the Age of 65 Comparison
Immigrants from Albania
Sioux
12.1%
SENIORS POVERTY OVER THE AGE OF 65
0.9/ 100
METRIC RATING
241st/ 347
METRIC RANK
15.3%
SENIORS POVERTY OVER THE AGE OF 65
0.0/ 100
METRIC RATING
328th/ 347
METRIC RANK
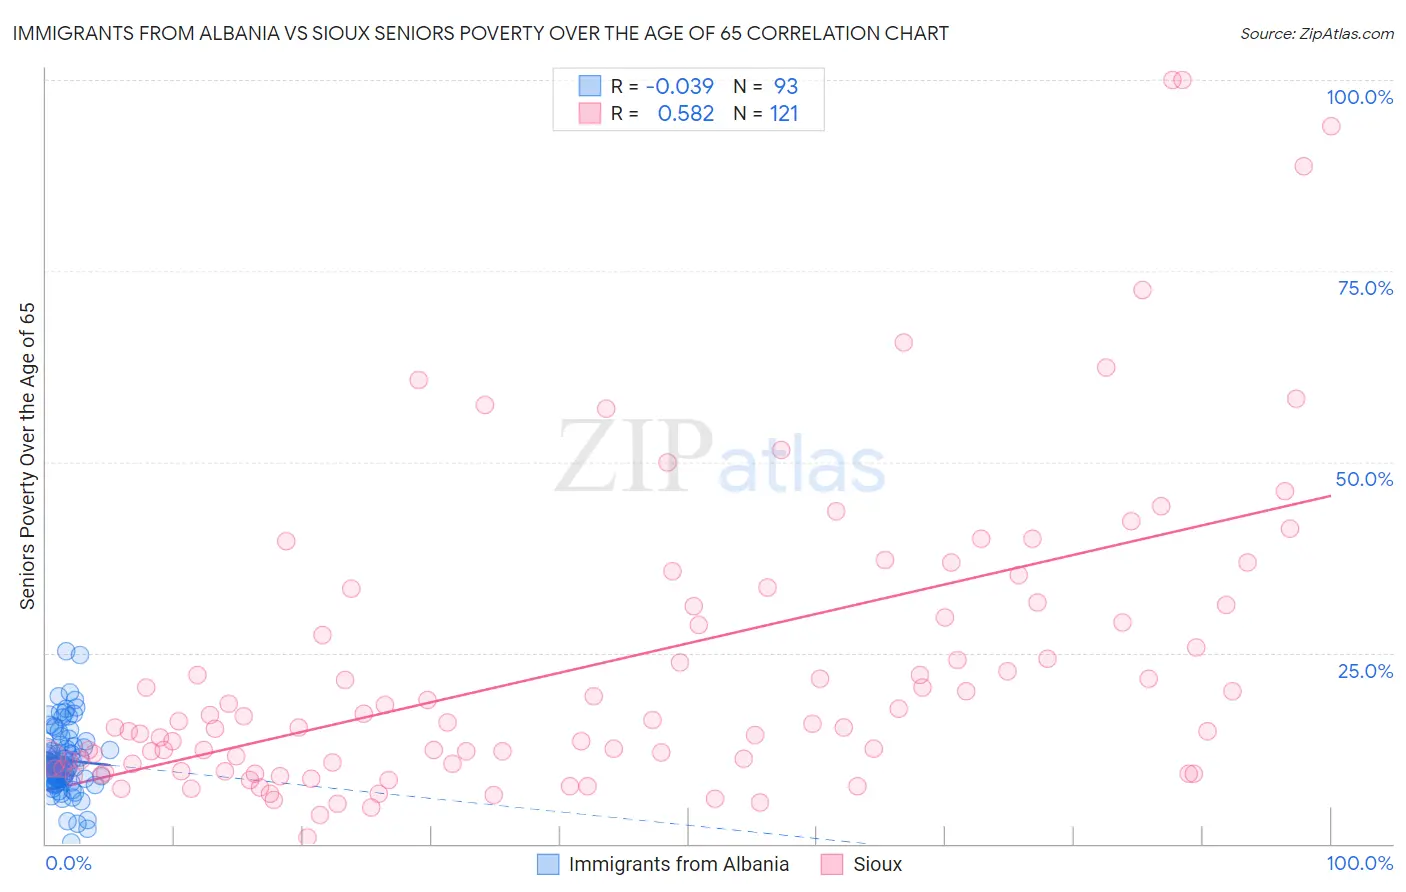
Immigrants from Albania vs Sioux Seniors Poverty Over the Age of 65 Correlation Chart
The statistical analysis conducted on geographies consisting of 119,248,637 people shows no correlation between the proportion of Immigrants from Albania and poverty level among seniors over the age of 65 in the United States with a correlation coefficient (R) of -0.039 and weighted average of 12.1%. Similarly, the statistical analysis conducted on geographies consisting of 233,565,707 people shows a substantial positive correlation between the proportion of Sioux and poverty level among seniors over the age of 65 in the United States with a correlation coefficient (R) of 0.582 and weighted average of 15.3%, a difference of 26.8%.
Seniors Poverty Over the Age of 65 Correlation Summary
| Measurement | Immigrants from Albania | Sioux |
| Minimum | 0.16% | 0.89% |
| Maximum | 25.1% | 100.0% |
| Range | 25.0% | 99.1% |
| Mean | 10.9% | 23.4% |
| Median | 10.4% | 15.7% |
| Interquartile 25% (IQ1) | 8.5% | 10.2% |
| Interquartile 75% (IQ3) | 12.7% | 31.2% |
| Interquartile Range (IQR) | 4.2% | 21.0% |
| Standard Deviation (Sample) | 4.4% | 20.2% |
| Standard Deviation (Population) | 4.3% | 20.1% |
Similar Demographics by Seniors Poverty Over the Age of 65
Demographics Similar to Immigrants from Albania by Seniors Poverty Over the Age of 65
In terms of seniors poverty over the age of 65, the demographic groups most similar to Immigrants from Albania are Comanche (12.1%, a difference of 0.020%), Subsaharan African (12.1%, a difference of 0.040%), Immigrants from Spain (12.1%, a difference of 0.12%), Uruguayan (12.1%, a difference of 0.16%), and Immigrants from Portugal (12.1%, a difference of 0.38%).
| Demographics | Rating | Rank | Seniors Poverty Over the Age of 65 |
| Iroquois | 1.7 /100 | #234 | Tragic 11.9% |
| Immigrants | Argentina | 1.3 /100 | #235 | Tragic 12.0% |
| Immigrants | Peru | 1.3 /100 | #236 | Tragic 12.0% |
| Moroccans | 1.2 /100 | #237 | Tragic 12.0% |
| Seminole | 1.1 /100 | #238 | Tragic 12.0% |
| Immigrants | Spain | 1.0 /100 | #239 | Tragic 12.1% |
| Comanche | 0.9 /100 | #240 | Tragic 12.1% |
| Immigrants | Albania | 0.9 /100 | #241 | Tragic 12.1% |
| Sub-Saharan Africans | 0.9 /100 | #242 | Tragic 12.1% |
| Uruguayans | 0.8 /100 | #243 | Tragic 12.1% |
| Immigrants | Portugal | 0.8 /100 | #244 | Tragic 12.1% |
| Chippewa | 0.7 /100 | #245 | Tragic 12.1% |
| Cree | 0.7 /100 | #246 | Tragic 12.1% |
| Japanese | 0.6 /100 | #247 | Tragic 12.2% |
| Spanish Americans | 0.6 /100 | #248 | Tragic 12.2% |
Demographics Similar to Sioux by Seniors Poverty Over the Age of 65
In terms of seniors poverty over the age of 65, the demographic groups most similar to Sioux are Crow (15.2%, a difference of 0.54%), Immigrants from Armenia (15.2%, a difference of 0.79%), Immigrants from Dominica (15.5%, a difference of 1.1%), Immigrants from St. Vincent and the Grenadines (15.5%, a difference of 1.4%), and Central American Indian (15.1%, a difference of 1.4%).
| Demographics | Rating | Rank | Seniors Poverty Over the Age of 65 |
| Houma | 0.0 /100 | #321 | Tragic 14.7% |
| Immigrants | Barbados | 0.0 /100 | #322 | Tragic 14.8% |
| Yakama | 0.0 /100 | #323 | Tragic 14.8% |
| Nicaraguans | 0.0 /100 | #324 | Tragic 15.0% |
| Central American Indians | 0.0 /100 | #325 | Tragic 15.1% |
| Immigrants | Armenia | 0.0 /100 | #326 | Tragic 15.2% |
| Crow | 0.0 /100 | #327 | Tragic 15.2% |
| Sioux | 0.0 /100 | #328 | Tragic 15.3% |
| Immigrants | Dominica | 0.0 /100 | #329 | Tragic 15.5% |
| Immigrants | St. Vincent and the Grenadines | 0.0 /100 | #330 | Tragic 15.5% |
| British West Indians | 0.0 /100 | #331 | Tragic 15.6% |
| Immigrants | Grenada | 0.0 /100 | #332 | Tragic 15.8% |
| Immigrants | Yemen | 0.0 /100 | #333 | Tragic 15.9% |
| Immigrants | Nicaragua | 0.0 /100 | #334 | Tragic 15.9% |
| Cubans | 0.0 /100 | #335 | Tragic 16.1% |