Immigrants from Albania vs Sioux GED/Equivalency
COMPARE
Immigrants from Albania
Sioux
GED/Equivalency
GED/Equivalency Comparison
Immigrants from Albania
Sioux
86.0%
GED/EQUIVALENCY
64.2/ 100
METRIC RATING
166th/ 347
METRIC RANK
82.6%
GED/EQUIVALENCY
0.1/ 100
METRIC RATING
281st/ 347
METRIC RANK
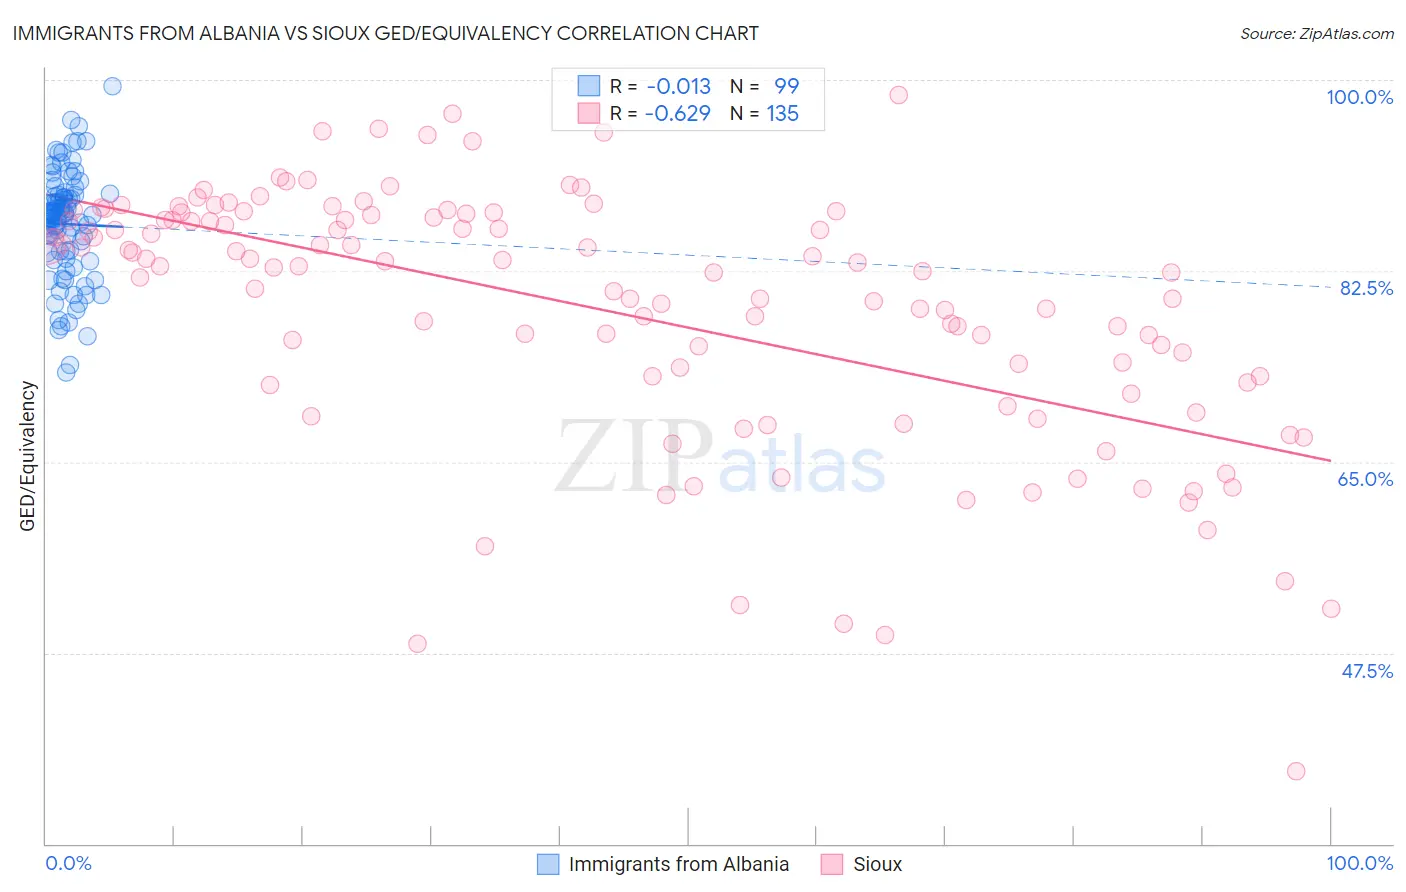
Immigrants from Albania vs Sioux GED/Equivalency Correlation Chart
The statistical analysis conducted on geographies consisting of 119,401,336 people shows no correlation between the proportion of Immigrants from Albania and percentage of population with at least ged/equivalency education in the United States with a correlation coefficient (R) of -0.013 and weighted average of 86.0%. Similarly, the statistical analysis conducted on geographies consisting of 234,200,345 people shows a significant negative correlation between the proportion of Sioux and percentage of population with at least ged/equivalency education in the United States with a correlation coefficient (R) of -0.629 and weighted average of 82.6%, a difference of 4.1%.
GED/Equivalency Correlation Summary
| Measurement | Immigrants from Albania | Sioux |
| Minimum | 73.2% | 36.6% |
| Maximum | 99.4% | 98.6% |
| Range | 26.2% | 62.0% |
| Mean | 86.8% | 78.9% |
| Median | 87.8% | 82.8% |
| Interquartile 25% (IQ1) | 84.3% | 72.3% |
| Interquartile 75% (IQ3) | 89.5% | 87.4% |
| Interquartile Range (IQR) | 5.2% | 15.2% |
| Standard Deviation (Sample) | 4.9% | 11.7% |
| Standard Deviation (Population) | 4.9% | 11.6% |
Similar Demographics by GED/Equivalency
Demographics Similar to Immigrants from Albania by GED/Equivalency
In terms of ged/equivalency, the demographic groups most similar to Immigrants from Albania are Alsatian (86.0%, a difference of 0.0%), Ethiopian (86.0%, a difference of 0.010%), Venezuelan (86.0%, a difference of 0.030%), Ugandan (86.1%, a difference of 0.050%), and Sierra Leonean (86.0%, a difference of 0.050%).
| Demographics | Rating | Rank | GED/Equivalency |
| Immigrants | Kenya | 71.8 /100 | #159 | Good 86.2% |
| Immigrants | Morocco | 69.5 /100 | #160 | Good 86.1% |
| Immigrants | Syria | 69.3 /100 | #161 | Good 86.1% |
| Immigrants | Iraq | 68.1 /100 | #162 | Good 86.1% |
| Ugandans | 66.3 /100 | #163 | Good 86.1% |
| Venezuelans | 65.5 /100 | #164 | Good 86.0% |
| Alsatians | 64.3 /100 | #165 | Good 86.0% |
| Immigrants | Albania | 64.2 /100 | #166 | Good 86.0% |
| Ethiopians | 63.7 /100 | #167 | Good 86.0% |
| Sierra Leoneans | 61.8 /100 | #168 | Good 86.0% |
| Immigrants | Ethiopia | 61.2 /100 | #169 | Good 86.0% |
| Afghans | 59.7 /100 | #170 | Average 85.9% |
| Immigrants | Chile | 57.3 /100 | #171 | Average 85.9% |
| Bermudans | 55.1 /100 | #172 | Average 85.8% |
| Immigrants | Venezuela | 50.7 /100 | #173 | Average 85.8% |
Demographics Similar to Sioux by GED/Equivalency
In terms of ged/equivalency, the demographic groups most similar to Sioux are Immigrants from Fiji (82.7%, a difference of 0.090%), Cheyenne (82.7%, a difference of 0.090%), Immigrants (82.6%, a difference of 0.090%), Immigrants from Laos (82.7%, a difference of 0.10%), and Arapaho (82.8%, a difference of 0.14%).
| Demographics | Rating | Rank | GED/Equivalency |
| Immigrants | Trinidad and Tobago | 0.1 /100 | #274 | Tragic 82.8% |
| Seminole | 0.1 /100 | #275 | Tragic 82.8% |
| Blacks/African Americans | 0.1 /100 | #276 | Tragic 82.8% |
| Arapaho | 0.1 /100 | #277 | Tragic 82.8% |
| Immigrants | Laos | 0.1 /100 | #278 | Tragic 82.7% |
| Immigrants | Fiji | 0.1 /100 | #279 | Tragic 82.7% |
| Cheyenne | 0.1 /100 | #280 | Tragic 82.7% |
| Sioux | 0.1 /100 | #281 | Tragic 82.6% |
| Immigrants | Immigrants | 0.1 /100 | #282 | Tragic 82.6% |
| Indonesians | 0.1 /100 | #283 | Tragic 82.5% |
| Immigrants | Barbados | 0.1 /100 | #284 | Tragic 82.4% |
| Cajuns | 0.0 /100 | #285 | Tragic 82.4% |
| Immigrants | West Indies | 0.0 /100 | #286 | Tragic 82.4% |
| Japanese | 0.0 /100 | #287 | Tragic 82.4% |
| Pueblo | 0.0 /100 | #288 | Tragic 82.3% |