Immigrants from Albania vs Lumbee Male Unemployment
COMPARE
Immigrants from Albania
Lumbee
Male Unemployment
Male Unemployment Comparison
Immigrants from Albania
Lumbee
5.5%
MALE UNEMPLOYMENT
3.6/ 100
METRIC RATING
218th/ 347
METRIC RANK
6.9%
MALE UNEMPLOYMENT
0.0/ 100
METRIC RATING
312th/ 347
METRIC RANK
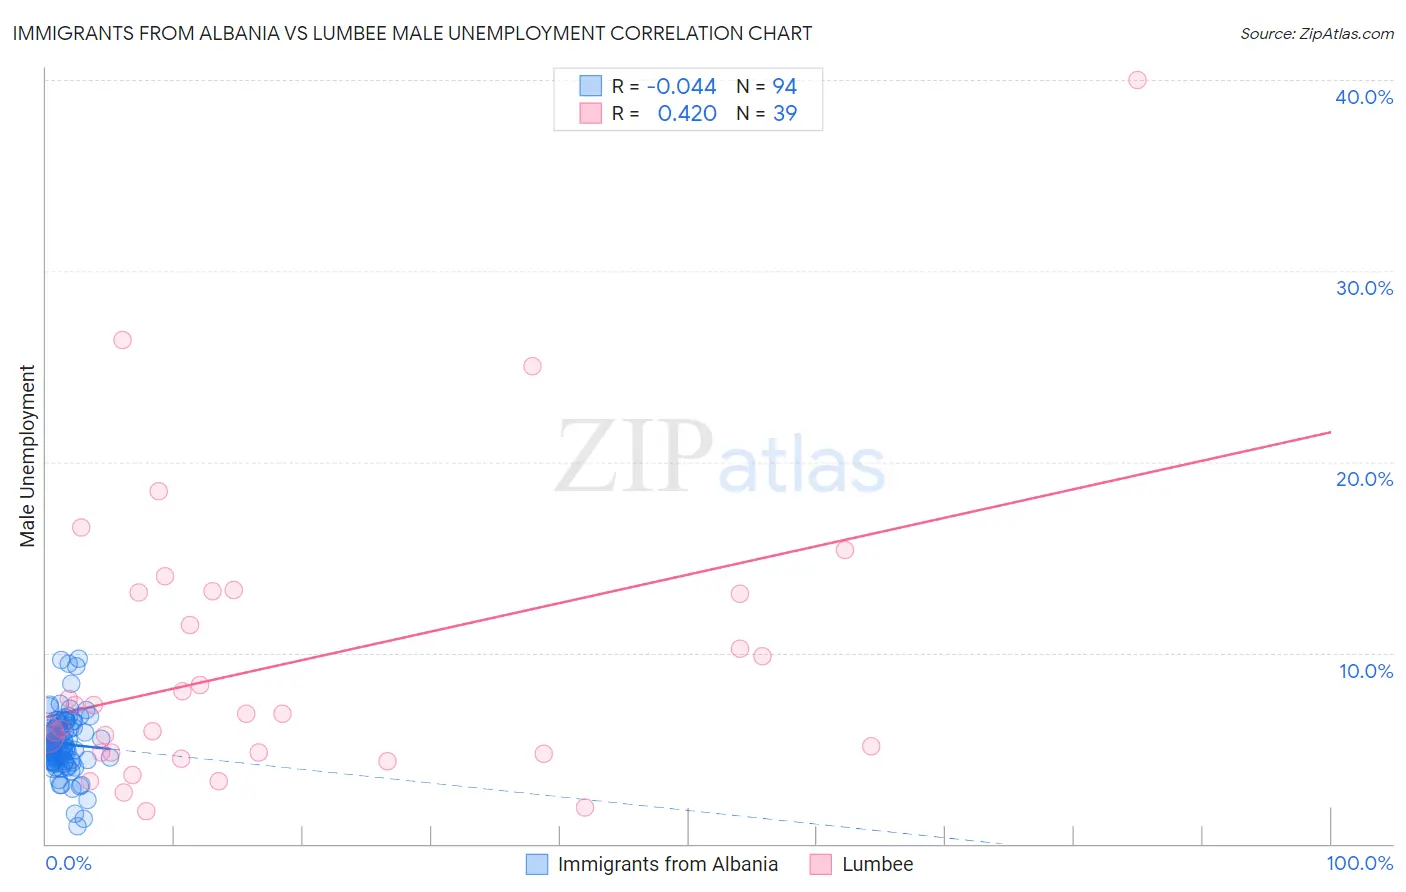
Immigrants from Albania vs Lumbee Male Unemployment Correlation Chart
The statistical analysis conducted on geographies consisting of 119,319,366 people shows no correlation between the proportion of Immigrants from Albania and unemployment rate among males in the United States with a correlation coefficient (R) of -0.044 and weighted average of 5.5%. Similarly, the statistical analysis conducted on geographies consisting of 92,069,666 people shows a moderate positive correlation between the proportion of Lumbee and unemployment rate among males in the United States with a correlation coefficient (R) of 0.420 and weighted average of 6.9%, a difference of 25.0%.
Male Unemployment Correlation Summary
| Measurement | Immigrants from Albania | Lumbee |
| Minimum | 0.90% | 1.7% |
| Maximum | 9.7% | 40.0% |
| Range | 8.8% | 38.3% |
| Mean | 5.2% | 9.5% |
| Median | 5.1% | 6.8% |
| Interquartile 25% (IQ1) | 4.3% | 4.8% |
| Interquartile 75% (IQ3) | 6.1% | 13.1% |
| Interquartile Range (IQR) | 1.8% | 8.4% |
| Standard Deviation (Sample) | 1.6% | 7.7% |
| Standard Deviation (Population) | 1.6% | 7.6% |
Similar Demographics by Male Unemployment
Demographics Similar to Immigrants from Albania by Male Unemployment
In terms of male unemployment, the demographic groups most similar to Immigrants from Albania are Immigrants from Western Asia (5.6%, a difference of 0.050%), Portuguese (5.6%, a difference of 0.070%), Soviet Union (5.6%, a difference of 0.18%), Delaware (5.5%, a difference of 0.21%), and Immigrants (5.5%, a difference of 0.26%).
| Demographics | Rating | Rank | Male Unemployment |
| Israelis | 7.4 /100 | #211 | Tragic 5.5% |
| Hmong | 7.0 /100 | #212 | Tragic 5.5% |
| Ugandans | 6.3 /100 | #213 | Tragic 5.5% |
| Puget Sound Salish | 5.6 /100 | #214 | Tragic 5.5% |
| Samoans | 4.9 /100 | #215 | Tragic 5.5% |
| Immigrants | Immigrants | 4.3 /100 | #216 | Tragic 5.5% |
| Delaware | 4.2 /100 | #217 | Tragic 5.5% |
| Immigrants | Albania | 3.6 /100 | #218 | Tragic 5.5% |
| Immigrants | Western Asia | 3.5 /100 | #219 | Tragic 5.6% |
| Portuguese | 3.5 /100 | #220 | Tragic 5.6% |
| Soviet Union | 3.2 /100 | #221 | Tragic 5.6% |
| Immigrants | Micronesia | 2.9 /100 | #222 | Tragic 5.6% |
| Creek | 2.6 /100 | #223 | Tragic 5.6% |
| Cherokee | 2.4 /100 | #224 | Tragic 5.6% |
| Panamanians | 1.9 /100 | #225 | Tragic 5.6% |
Demographics Similar to Lumbee by Male Unemployment
In terms of male unemployment, the demographic groups most similar to Lumbee are Immigrants from Armenia (6.9%, a difference of 0.20%), Black/African American (6.9%, a difference of 0.52%), Immigrants from Dominica (7.0%, a difference of 1.0%), Barbadian (6.9%, a difference of 1.2%), and Aleut (6.8%, a difference of 1.6%).
| Demographics | Rating | Rank | Male Unemployment |
| Trinidadians and Tobagonians | 0.0 /100 | #305 | Tragic 6.7% |
| Immigrants | Trinidad and Tobago | 0.0 /100 | #306 | Tragic 6.7% |
| Immigrants | Jamaica | 0.0 /100 | #307 | Tragic 6.7% |
| Aleuts | 0.0 /100 | #308 | Tragic 6.8% |
| Barbadians | 0.0 /100 | #309 | Tragic 6.9% |
| Blacks/African Americans | 0.0 /100 | #310 | Tragic 6.9% |
| Immigrants | Armenia | 0.0 /100 | #311 | Tragic 6.9% |
| Lumbee | 0.0 /100 | #312 | Tragic 6.9% |
| Immigrants | Dominica | 0.0 /100 | #313 | Tragic 7.0% |
| Immigrants | Barbados | 0.0 /100 | #314 | Tragic 7.1% |
| Houma | 0.0 /100 | #315 | Tragic 7.1% |
| Immigrants | Guyana | 0.0 /100 | #316 | Tragic 7.1% |
| Guyanese | 0.0 /100 | #317 | Tragic 7.1% |
| Cape Verdeans | 0.0 /100 | #318 | Tragic 7.1% |
| British West Indians | 0.0 /100 | #319 | Tragic 7.3% |