Houma vs Japanese Unemployment
COMPARE
Houma
Japanese
Unemployment
Unemployment Comparison
Houma
Japanese
6.7%
UNEMPLOYMENT
0.0/ 100
METRIC RATING
315th/ 347
METRIC RANK
5.6%
UNEMPLOYMENT
0.8/ 100
METRIC RATING
250th/ 347
METRIC RANK
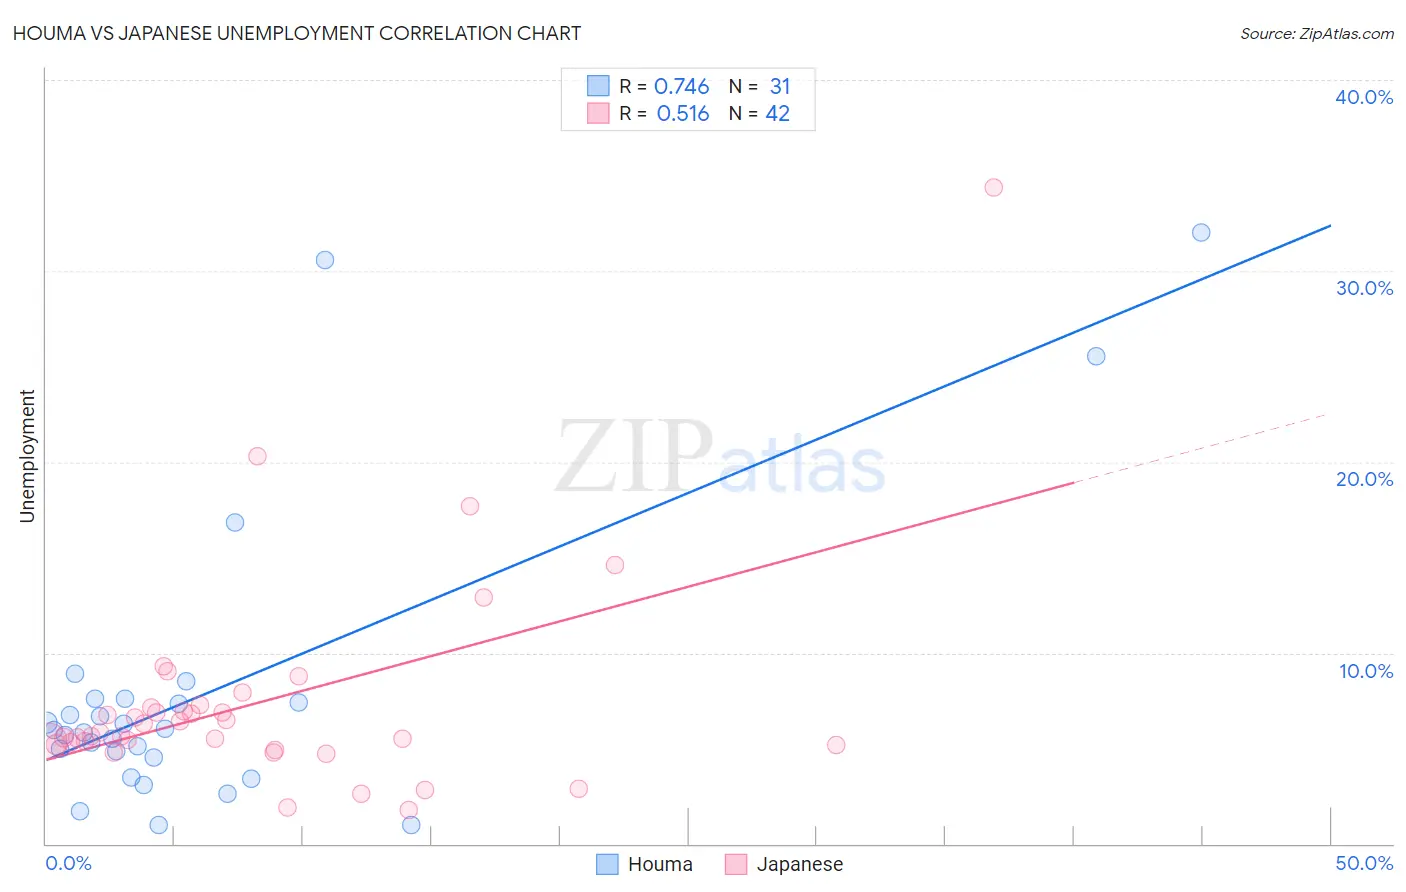
Houma vs Japanese Unemployment Correlation Chart
The statistical analysis conducted on geographies consisting of 36,775,803 people shows a strong positive correlation between the proportion of Houma and unemployment in the United States with a correlation coefficient (R) of 0.746 and weighted average of 6.7%. Similarly, the statistical analysis conducted on geographies consisting of 249,076,576 people shows a substantial positive correlation between the proportion of Japanese and unemployment in the United States with a correlation coefficient (R) of 0.516 and weighted average of 5.6%, a difference of 18.3%.
Unemployment Correlation Summary
| Measurement | Houma | Japanese |
| Minimum | 1.0% | 1.8% |
| Maximum | 32.0% | 34.4% |
| Range | 31.0% | 32.6% |
| Mean | 8.0% | 7.4% |
| Median | 6.0% | 5.8% |
| Interquartile 25% (IQ1) | 4.5% | 5.2% |
| Interquartile 75% (IQ3) | 7.6% | 7.1% |
| Interquartile Range (IQR) | 3.1% | 1.9% |
| Standard Deviation (Sample) | 7.7% | 5.6% |
| Standard Deviation (Population) | 7.6% | 5.6% |
Similar Demographics by Unemployment
Demographics Similar to Houma by Unemployment
In terms of unemployment, the demographic groups most similar to Houma are Black/African American (6.6%, a difference of 0.80%), Immigrants from Dominica (6.7%, a difference of 0.83%), Immigrants from Barbados (6.6%, a difference of 1.3%), Shoshone (6.8%, a difference of 1.4%), and Colville (6.6%, a difference of 1.7%).
| Demographics | Rating | Rank | Unemployment |
| Barbadians | 0.0 /100 | #308 | Tragic 6.5% |
| Vietnamese | 0.0 /100 | #309 | Tragic 6.5% |
| Immigrants | Belize | 0.0 /100 | #310 | Tragic 6.5% |
| Cape Verdeans | 0.0 /100 | #311 | Tragic 6.5% |
| Colville | 0.0 /100 | #312 | Tragic 6.6% |
| Immigrants | Barbados | 0.0 /100 | #313 | Tragic 6.6% |
| Blacks/African Americans | 0.0 /100 | #314 | Tragic 6.6% |
| Houma | 0.0 /100 | #315 | Tragic 6.7% |
| Immigrants | Dominica | 0.0 /100 | #316 | Tragic 6.7% |
| Shoshone | 0.0 /100 | #317 | Tragic 6.8% |
| Immigrants | Cabo Verde | 0.0 /100 | #318 | Tragic 6.8% |
| British West Indians | 0.0 /100 | #319 | Tragic 6.8% |
| Immigrants | St. Vincent and the Grenadines | 0.0 /100 | #320 | Tragic 6.9% |
| Immigrants | Guyana | 0.0 /100 | #321 | Tragic 6.9% |
| Guyanese | 0.0 /100 | #322 | Tragic 6.9% |
Demographics Similar to Japanese by Unemployment
In terms of unemployment, the demographic groups most similar to Japanese are Cajun (5.6%, a difference of 0.010%), Liberian (5.6%, a difference of 0.27%), Immigrants from Cameroon (5.6%, a difference of 0.40%), Kiowa (5.7%, a difference of 0.47%), and Bermudan (5.6%, a difference of 0.55%).
| Demographics | Rating | Rank | Unemployment |
| Marshallese | 1.3 /100 | #243 | Tragic 5.6% |
| Dutch West Indians | 1.2 /100 | #244 | Tragic 5.6% |
| French American Indians | 1.2 /100 | #245 | Tragic 5.6% |
| Bermudans | 1.1 /100 | #246 | Tragic 5.6% |
| Immigrants | Cameroon | 1.0 /100 | #247 | Tragic 5.6% |
| Liberians | 0.9 /100 | #248 | Tragic 5.6% |
| Cajuns | 0.8 /100 | #249 | Tragic 5.6% |
| Japanese | 0.8 /100 | #250 | Tragic 5.6% |
| Kiowa | 0.6 /100 | #251 | Tragic 5.7% |
| Hondurans | 0.3 /100 | #252 | Tragic 5.7% |
| Central Americans | 0.3 /100 | #253 | Tragic 5.7% |
| Immigrants | Honduras | 0.3 /100 | #254 | Tragic 5.7% |
| Immigrants | Portugal | 0.2 /100 | #255 | Tragic 5.7% |
| Guatemalans | 0.2 /100 | #256 | Tragic 5.8% |
| Yaqui | 0.2 /100 | #257 | Tragic 5.8% |