Hawaiian vs Pueblo Female Unemployment
COMPARE
Hawaiian
Pueblo
Female Unemployment
Female Unemployment Comparison
Hawaiians
Pueblo
5.4%
FEMALE UNEMPLOYMENT
22.2/ 100
METRIC RATING
199th/ 347
METRIC RANK
6.4%
FEMALE UNEMPLOYMENT
0.0/ 100
METRIC RATING
315th/ 347
METRIC RANK
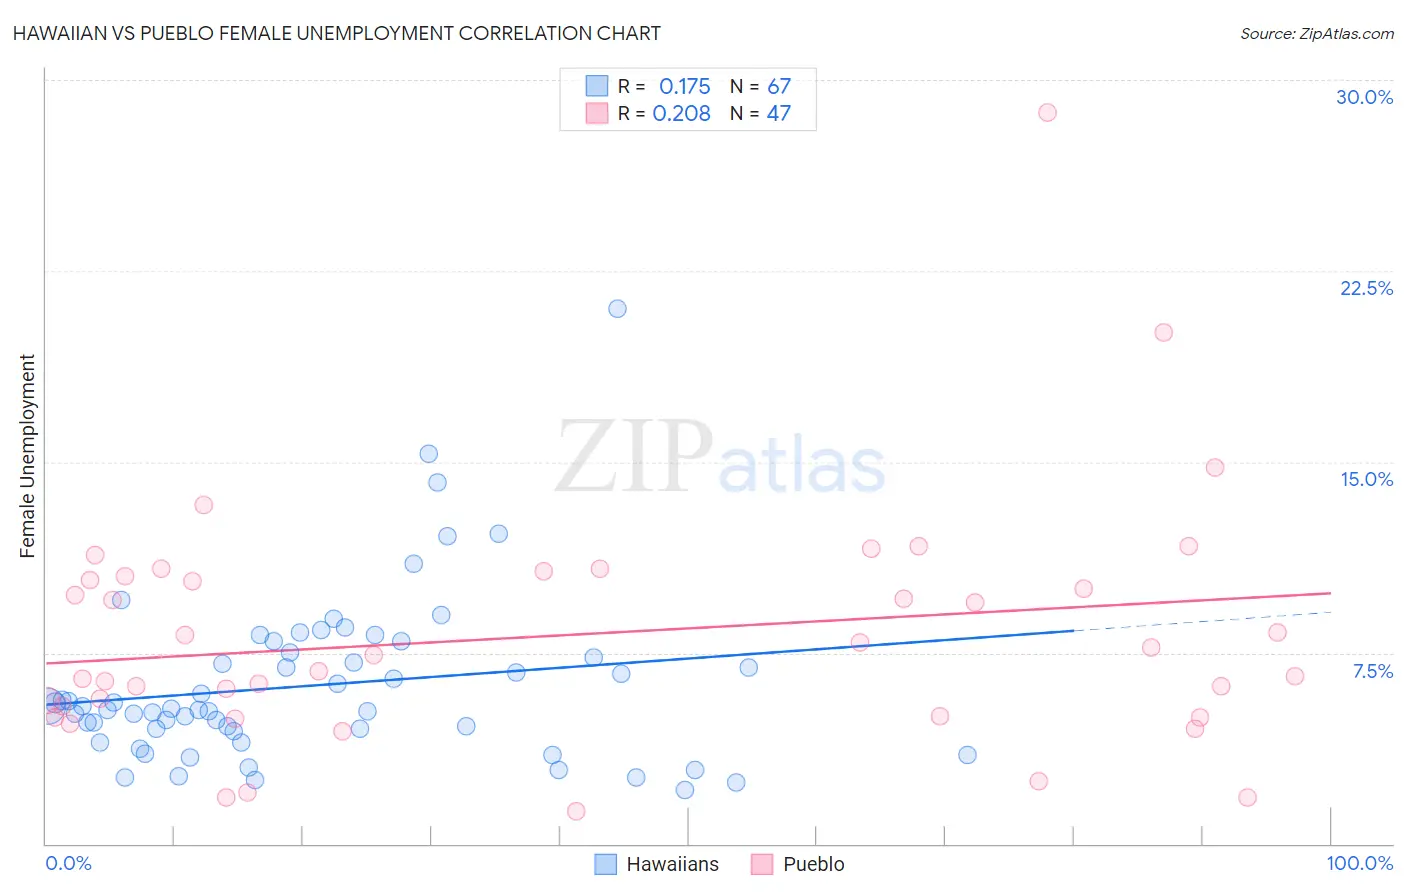
Hawaiian vs Pueblo Female Unemployment Correlation Chart
The statistical analysis conducted on geographies consisting of 326,158,717 people shows a poor positive correlation between the proportion of Hawaiians and unemploymnet rate among females in the United States with a correlation coefficient (R) of 0.175 and weighted average of 5.4%. Similarly, the statistical analysis conducted on geographies consisting of 119,838,706 people shows a weak positive correlation between the proportion of Pueblo and unemploymnet rate among females in the United States with a correlation coefficient (R) of 0.208 and weighted average of 6.4%, a difference of 19.1%.
Female Unemployment Correlation Summary
| Measurement | Hawaiian | Pueblo |
| Minimum | 2.1% | 1.3% |
| Maximum | 21.0% | 28.7% |
| Range | 18.9% | 27.4% |
| Mean | 6.2% | 8.2% |
| Median | 5.3% | 7.4% |
| Interquartile 25% (IQ1) | 4.4% | 5.0% |
| Interquartile 75% (IQ3) | 7.5% | 10.5% |
| Interquartile Range (IQR) | 3.1% | 5.5% |
| Standard Deviation (Sample) | 3.3% | 4.8% |
| Standard Deviation (Population) | 3.3% | 4.7% |
Similar Demographics by Female Unemployment
Demographics Similar to Hawaiians by Female Unemployment
In terms of female unemployment, the demographic groups most similar to Hawaiians are Soviet Union (5.4%, a difference of 0.040%), Tsimshian (5.4%, a difference of 0.080%), Immigrants from Middle Africa (5.4%, a difference of 0.12%), Iroquois (5.4%, a difference of 0.12%), and Alsatian (5.3%, a difference of 0.14%).
| Demographics | Rating | Rank | Female Unemployment |
| Portuguese | 28.6 /100 | #192 | Fair 5.3% |
| Arabs | 27.7 /100 | #193 | Fair 5.3% |
| Colombians | 27.0 /100 | #194 | Fair 5.3% |
| Immigrants | Colombia | 26.2 /100 | #195 | Fair 5.3% |
| Spaniards | 25.2 /100 | #196 | Fair 5.3% |
| Alsatians | 23.9 /100 | #197 | Fair 5.3% |
| Tsimshian | 23.1 /100 | #198 | Fair 5.4% |
| Hawaiians | 22.2 /100 | #199 | Fair 5.4% |
| Soviet Union | 21.7 /100 | #200 | Fair 5.4% |
| Immigrants | Middle Africa | 20.8 /100 | #201 | Fair 5.4% |
| Iroquois | 20.8 /100 | #202 | Fair 5.4% |
| Immigrants | South Eastern Asia | 20.3 /100 | #203 | Fair 5.4% |
| Immigrants | Israel | 19.7 /100 | #204 | Poor 5.4% |
| Immigrants | Afghanistan | 18.9 /100 | #205 | Poor 5.4% |
| Immigrants | Brazil | 18.8 /100 | #206 | Poor 5.4% |
Demographics Similar to Pueblo by Female Unemployment
In terms of female unemployment, the demographic groups most similar to Pueblo are Houma (6.4%, a difference of 0.29%), Immigrants from Ecuador (6.4%, a difference of 0.31%), Belizean (6.3%, a difference of 0.54%), Immigrants from Grenada (6.3%, a difference of 0.55%), and Immigrants from St. Vincent and the Grenadines (6.4%, a difference of 0.74%).
| Demographics | Rating | Rank | Female Unemployment |
| Hispanics or Latinos | 0.0 /100 | #308 | Tragic 6.2% |
| Ecuadorians | 0.0 /100 | #309 | Tragic 6.3% |
| Central American Indians | 0.0 /100 | #310 | Tragic 6.3% |
| Immigrants | Mexico | 0.0 /100 | #311 | Tragic 6.3% |
| Immigrants | Grenada | 0.0 /100 | #312 | Tragic 6.3% |
| Belizeans | 0.0 /100 | #313 | Tragic 6.3% |
| Immigrants | Ecuador | 0.0 /100 | #314 | Tragic 6.4% |
| Pueblo | 0.0 /100 | #315 | Tragic 6.4% |
| Houma | 0.0 /100 | #316 | Tragic 6.4% |
| Immigrants | St. Vincent and the Grenadines | 0.0 /100 | #317 | Tragic 6.4% |
| British West Indians | 0.0 /100 | #318 | Tragic 6.4% |
| Immigrants | Bangladesh | 0.0 /100 | #319 | Tragic 6.5% |
| Immigrants | Dominica | 0.0 /100 | #320 | Tragic 6.5% |
| Blacks/African Americans | 0.0 /100 | #321 | Tragic 6.5% |
| Vietnamese | 0.0 /100 | #322 | Tragic 6.5% |