Hawaiian vs Immigrants from Brazil College, 1 year or more
COMPARE
Hawaiian
Immigrants from Brazil
College, 1 year or more
College, 1 year or more Comparison
Hawaiians
Immigrants from Brazil
55.6%
COLLEGE, 1 YEAR OR MORE
0.8/ 100
METRIC RATING
247th/ 347
METRIC RANK
61.6%
COLLEGE, 1 YEAR OR MORE
93.9/ 100
METRIC RATING
118th/ 347
METRIC RANK
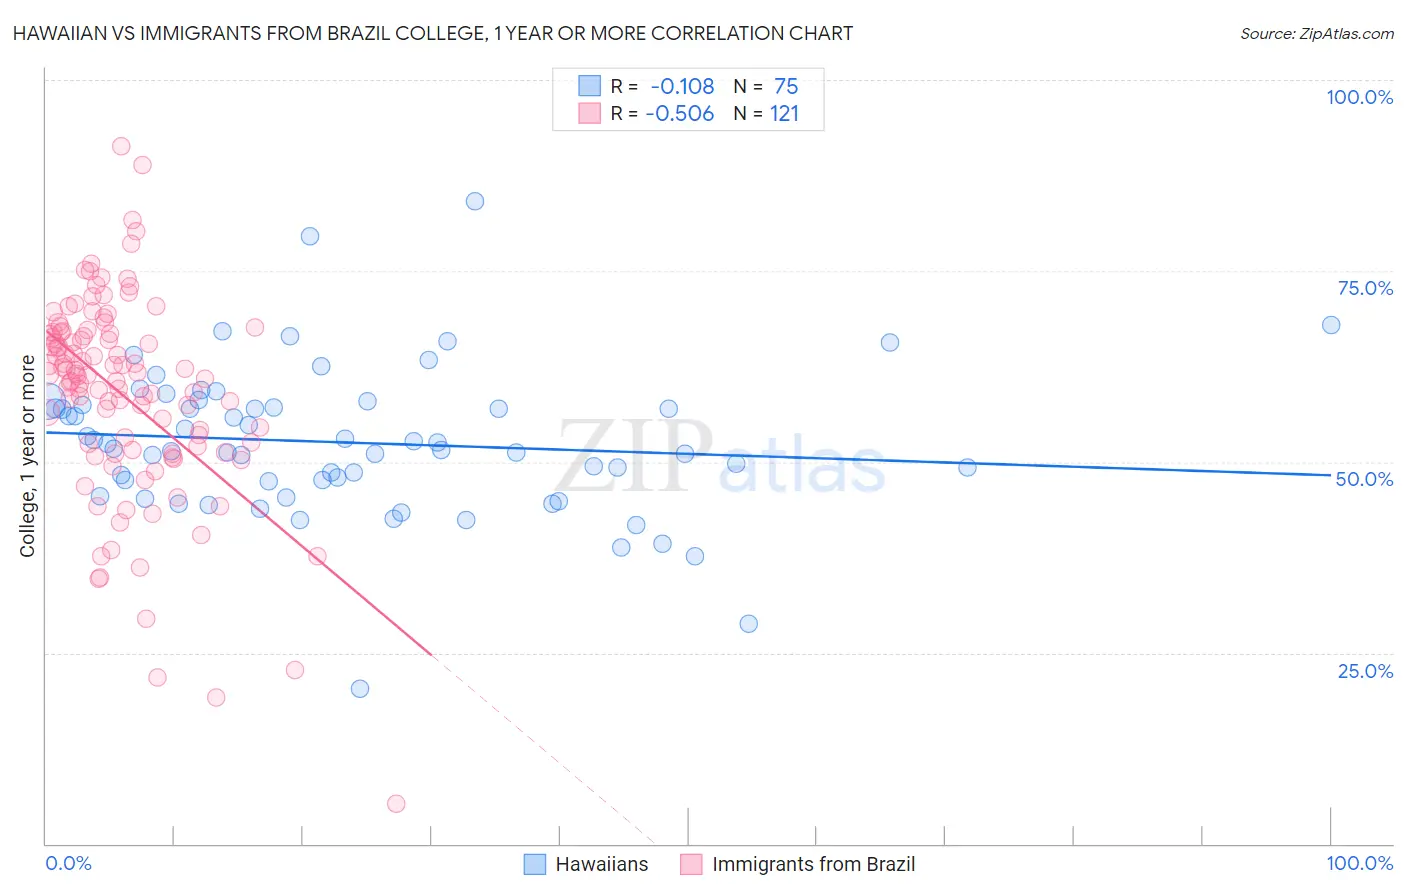
Hawaiian vs Immigrants from Brazil College, 1 year or more Correlation Chart
The statistical analysis conducted on geographies consisting of 327,619,549 people shows a poor negative correlation between the proportion of Hawaiians and percentage of population with at least college, 1 year or more education in the United States with a correlation coefficient (R) of -0.108 and weighted average of 55.6%. Similarly, the statistical analysis conducted on geographies consisting of 343,021,697 people shows a substantial negative correlation between the proportion of Immigrants from Brazil and percentage of population with at least college, 1 year or more education in the United States with a correlation coefficient (R) of -0.506 and weighted average of 61.6%, a difference of 10.8%.
College, 1 year or more Correlation Summary
| Measurement | Hawaiian | Immigrants from Brazil |
| Minimum | 20.3% | 5.3% |
| Maximum | 84.1% | 91.3% |
| Range | 63.8% | 86.0% |
| Mean | 52.5% | 58.8% |
| Median | 51.7% | 61.4% |
| Interquartile 25% (IQ1) | 47.5% | 51.8% |
| Interquartile 75% (IQ3) | 57.4% | 66.8% |
| Interquartile Range (IQR) | 9.9% | 15.0% |
| Standard Deviation (Sample) | 9.7% | 13.5% |
| Standard Deviation (Population) | 9.7% | 13.4% |
Similar Demographics by College, 1 year or more
Demographics Similar to Hawaiians by College, 1 year or more
In terms of college, 1 year or more, the demographic groups most similar to Hawaiians are Immigrants from Congo (55.6%, a difference of 0.040%), Malaysian (55.6%, a difference of 0.070%), Immigrants from Liberia (55.7%, a difference of 0.12%), Immigrants from Trinidad and Tobago (55.5%, a difference of 0.13%), and Delaware (55.5%, a difference of 0.16%).
| Demographics | Rating | Rank | College, 1 year or more |
| Trinidadians and Tobagonians | 1.1 /100 | #240 | Tragic 55.8% |
| French American Indians | 1.0 /100 | #241 | Tragic 55.8% |
| Marshallese | 1.0 /100 | #242 | Tragic 55.8% |
| Osage | 1.0 /100 | #243 | Tragic 55.8% |
| Chippewa | 0.9 /100 | #244 | Tragic 55.7% |
| Immigrants | Liberia | 0.8 /100 | #245 | Tragic 55.7% |
| Malaysians | 0.8 /100 | #246 | Tragic 55.6% |
| Hawaiians | 0.8 /100 | #247 | Tragic 55.6% |
| Immigrants | Congo | 0.8 /100 | #248 | Tragic 55.6% |
| Immigrants | Trinidad and Tobago | 0.7 /100 | #249 | Tragic 55.5% |
| Delaware | 0.7 /100 | #250 | Tragic 55.5% |
| Immigrants | Cambodia | 0.6 /100 | #251 | Tragic 55.4% |
| Aleuts | 0.6 /100 | #252 | Tragic 55.4% |
| Immigrants | Barbados | 0.6 /100 | #253 | Tragic 55.4% |
| Japanese | 0.5 /100 | #254 | Tragic 55.2% |
Demographics Similar to Immigrants from Brazil by College, 1 year or more
In terms of college, 1 year or more, the demographic groups most similar to Immigrants from Brazil are Arab (61.6%, a difference of 0.0%), Lebanese (61.6%, a difference of 0.050%), Assyrian/Chaldean/Syriac (61.5%, a difference of 0.13%), Pakistani (61.5%, a difference of 0.14%), and Norwegian (61.7%, a difference of 0.15%).
| Demographics | Rating | Rank | College, 1 year or more |
| Macedonians | 95.6 /100 | #111 | Exceptional 61.8% |
| Austrians | 95.4 /100 | #112 | Exceptional 61.8% |
| Ukrainians | 95.2 /100 | #113 | Exceptional 61.8% |
| Danes | 94.8 /100 | #114 | Exceptional 61.7% |
| Norwegians | 94.5 /100 | #115 | Exceptional 61.7% |
| Lebanese | 94.1 /100 | #116 | Exceptional 61.6% |
| Arabs | 93.9 /100 | #117 | Exceptional 61.6% |
| Immigrants | Brazil | 93.9 /100 | #118 | Exceptional 61.6% |
| Assyrians/Chaldeans/Syriacs | 93.3 /100 | #119 | Exceptional 61.5% |
| Pakistanis | 93.2 /100 | #120 | Exceptional 61.5% |
| Immigrants | Jordan | 92.7 /100 | #121 | Exceptional 61.4% |
| Immigrants | Chile | 92.3 /100 | #122 | Exceptional 61.4% |
| Serbians | 92.2 /100 | #123 | Exceptional 61.4% |
| Venezuelans | 92.1 /100 | #124 | Exceptional 61.3% |
| Immigrants | Syria | 91.6 /100 | #125 | Exceptional 61.3% |