Hawaiian vs Immigrants from Ukraine Female Unemployment
COMPARE
Hawaiian
Immigrants from Ukraine
Female Unemployment
Female Unemployment Comparison
Hawaiians
Immigrants from Ukraine
5.4%
FEMALE UNEMPLOYMENT
22.2/ 100
METRIC RATING
199th/ 347
METRIC RANK
5.3%
FEMALE UNEMPLOYMENT
40.1/ 100
METRIC RATING
184th/ 347
METRIC RANK
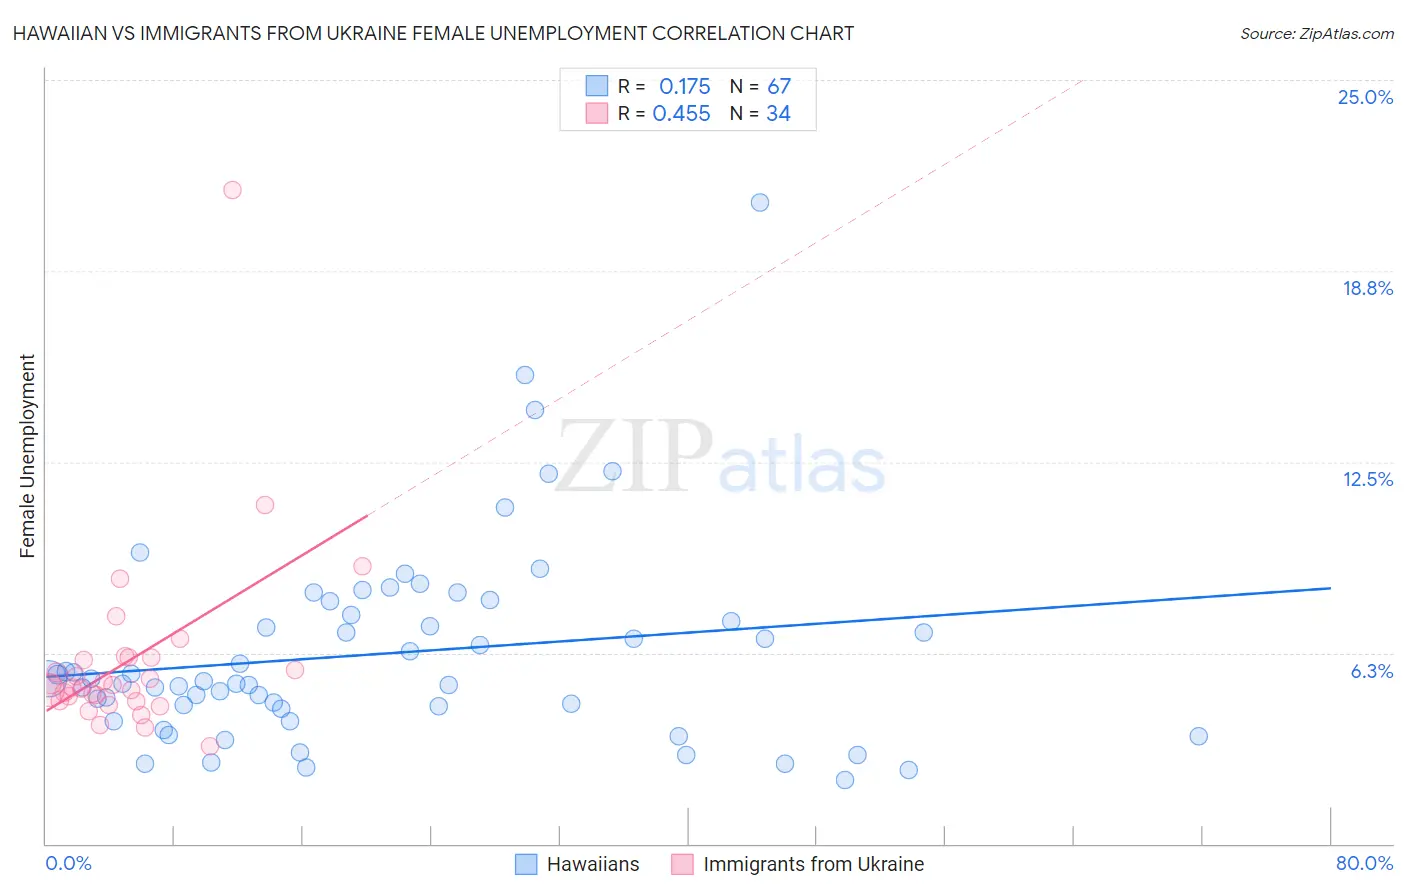
Hawaiian vs Immigrants from Ukraine Female Unemployment Correlation Chart
The statistical analysis conducted on geographies consisting of 326,158,717 people shows a poor positive correlation between the proportion of Hawaiians and unemploymnet rate among females in the United States with a correlation coefficient (R) of 0.175 and weighted average of 5.4%. Similarly, the statistical analysis conducted on geographies consisting of 288,858,006 people shows a moderate positive correlation between the proportion of Immigrants from Ukraine and unemploymnet rate among females in the United States with a correlation coefficient (R) of 0.455 and weighted average of 5.3%, a difference of 1.3%.
Female Unemployment Correlation Summary
| Measurement | Hawaiian | Immigrants from Ukraine |
| Minimum | 2.1% | 3.2% |
| Maximum | 21.0% | 21.4% |
| Range | 18.9% | 18.2% |
| Mean | 6.2% | 6.0% |
| Median | 5.3% | 5.2% |
| Interquartile 25% (IQ1) | 4.4% | 4.7% |
| Interquartile 75% (IQ3) | 7.5% | 6.1% |
| Interquartile Range (IQR) | 3.1% | 1.4% |
| Standard Deviation (Sample) | 3.3% | 3.1% |
| Standard Deviation (Population) | 3.3% | 3.1% |
Demographics Similar to Hawaiians and Immigrants from Ukraine by Female Unemployment
In terms of female unemployment, the demographic groups most similar to Hawaiians are Soviet Union (5.4%, a difference of 0.040%), Tsimshian (5.4%, a difference of 0.080%), Immigrants from Middle Africa (5.4%, a difference of 0.12%), Alsatian (5.3%, a difference of 0.14%), and Spaniard (5.3%, a difference of 0.25%). Similarly, the demographic groups most similar to Immigrants from Ukraine are Malaysian (5.3%, a difference of 0.010%), Immigrants from Indonesia (5.3%, a difference of 0.030%), Immigrants from Belarus (5.3%, a difference of 0.050%), Nonimmigrants (5.3%, a difference of 0.15%), and Taiwanese (5.3%, a difference of 0.16%).
| Demographics | Rating | Rank | Female Unemployment |
| Taiwanese | 42.7 /100 | #181 | Average 5.3% |
| Immigrants | Nonimmigrants | 42.6 /100 | #182 | Average 5.3% |
| Immigrants | Indonesia | 40.7 /100 | #183 | Average 5.3% |
| Immigrants | Ukraine | 40.1 /100 | #184 | Average 5.3% |
| Malaysians | 40.1 /100 | #185 | Average 5.3% |
| Immigrants | Belarus | 39.4 /100 | #186 | Fair 5.3% |
| Immigrants | Albania | 35.4 /100 | #187 | Fair 5.3% |
| Afghans | 33.9 /100 | #188 | Fair 5.3% |
| Costa Ricans | 33.8 /100 | #189 | Fair 5.3% |
| Ugandans | 31.2 /100 | #190 | Fair 5.3% |
| Cherokee | 30.8 /100 | #191 | Fair 5.3% |
| Portuguese | 28.6 /100 | #192 | Fair 5.3% |
| Arabs | 27.7 /100 | #193 | Fair 5.3% |
| Colombians | 27.0 /100 | #194 | Fair 5.3% |
| Immigrants | Colombia | 26.2 /100 | #195 | Fair 5.3% |
| Spaniards | 25.2 /100 | #196 | Fair 5.3% |
| Alsatians | 23.9 /100 | #197 | Fair 5.3% |
| Tsimshian | 23.1 /100 | #198 | Fair 5.4% |
| Hawaiians | 22.2 /100 | #199 | Fair 5.4% |
| Soviet Union | 21.7 /100 | #200 | Fair 5.4% |
| Immigrants | Middle Africa | 20.8 /100 | #201 | Fair 5.4% |