Ghanaian vs Immigrants from Northern Africa Male Unemployment
COMPARE
Ghanaian
Immigrants from Northern Africa
Male Unemployment
Male Unemployment Comparison
Ghanaians
Immigrants from Northern Africa
6.1%
MALE UNEMPLOYMENT
0.0/ 100
METRIC RATING
279th/ 347
METRIC RANK
5.2%
MALE UNEMPLOYMENT
72.3/ 100
METRIC RATING
157th/ 347
METRIC RANK
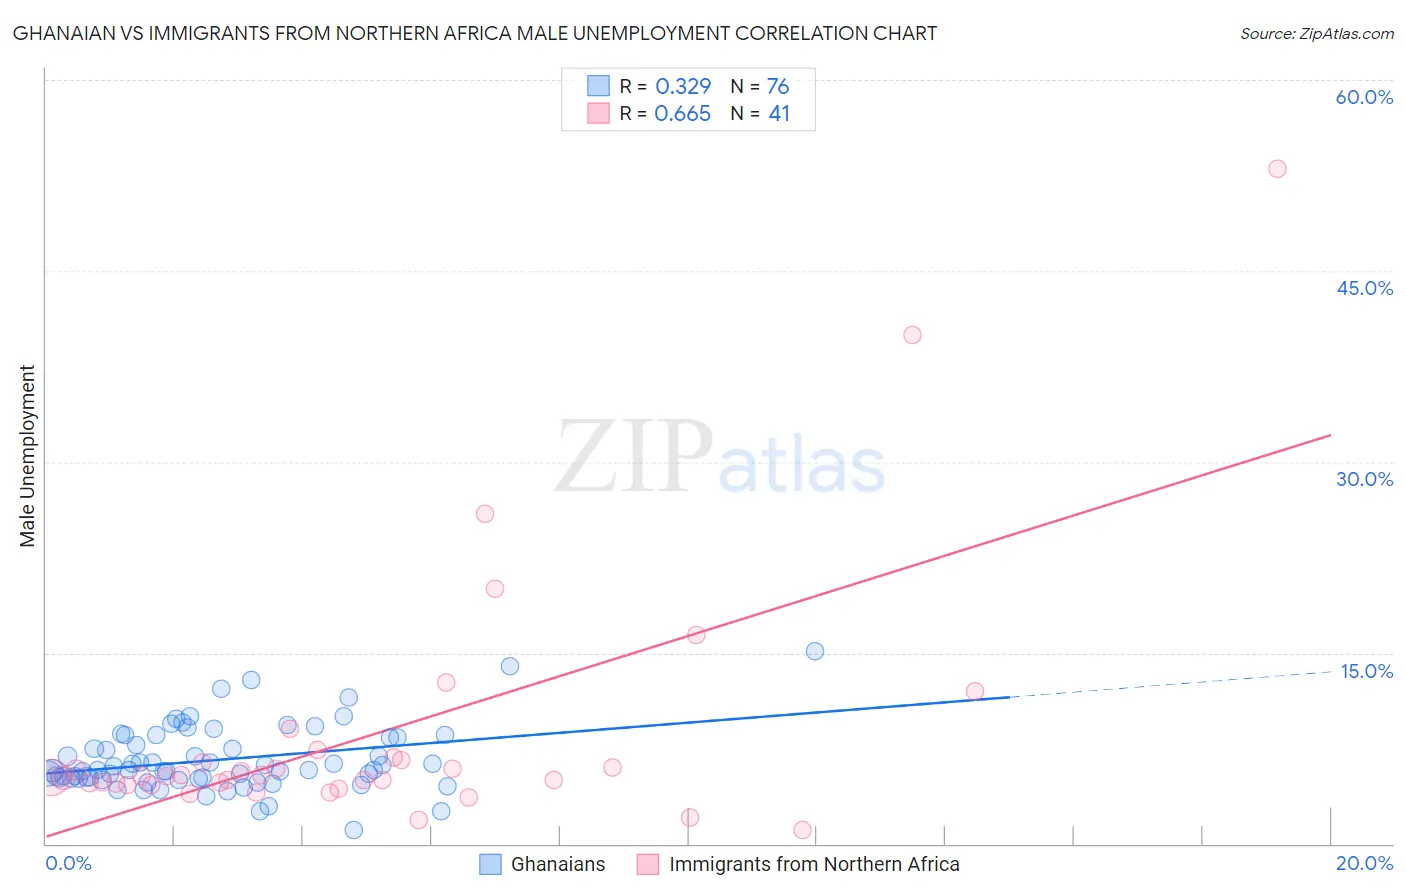
Ghanaian vs Immigrants from Northern Africa Male Unemployment Correlation Chart
The statistical analysis conducted on geographies consisting of 190,397,000 people shows a mild positive correlation between the proportion of Ghanaians and unemployment rate among males in the United States with a correlation coefficient (R) of 0.329 and weighted average of 6.1%. Similarly, the statistical analysis conducted on geographies consisting of 320,554,315 people shows a significant positive correlation between the proportion of Immigrants from Northern Africa and unemployment rate among males in the United States with a correlation coefficient (R) of 0.665 and weighted average of 5.2%, a difference of 16.7%.
Male Unemployment Correlation Summary
| Measurement | Ghanaian | Immigrants from Northern Africa |
| Minimum | 1.1% | 1.1% |
| Maximum | 15.1% | 53.0% |
| Range | 14.0% | 51.9% |
| Mean | 6.6% | 8.6% |
| Median | 5.8% | 5.3% |
| Interquartile 25% (IQ1) | 5.1% | 4.7% |
| Interquartile 75% (IQ3) | 8.3% | 6.7% |
| Interquartile Range (IQR) | 3.2% | 2.0% |
| Standard Deviation (Sample) | 2.6% | 10.0% |
| Standard Deviation (Population) | 2.5% | 9.9% |
Similar Demographics by Male Unemployment
Demographics Similar to Ghanaians by Male Unemployment
In terms of male unemployment, the demographic groups most similar to Ghanaians are Immigrants from Fiji (6.1%, a difference of 0.50%), Immigrants from Liberia (6.1%, a difference of 0.62%), Immigrants from Ghana (6.2%, a difference of 0.99%), Tlingit-Haida (6.0%, a difference of 1.1%), and Sierra Leonean (6.2%, a difference of 1.1%).
| Demographics | Rating | Rank | Male Unemployment |
| Immigrants | Uzbekistan | 0.0 /100 | #272 | Tragic 6.0% |
| Armenians | 0.0 /100 | #273 | Tragic 6.0% |
| Immigrants | Sierra Leone | 0.0 /100 | #274 | Tragic 6.0% |
| Menominee | 0.0 /100 | #275 | Tragic 6.0% |
| Tlingit-Haida | 0.0 /100 | #276 | Tragic 6.0% |
| Immigrants | Liberia | 0.0 /100 | #277 | Tragic 6.1% |
| Immigrants | Fiji | 0.0 /100 | #278 | Tragic 6.1% |
| Ghanaians | 0.0 /100 | #279 | Tragic 6.1% |
| Immigrants | Ghana | 0.0 /100 | #280 | Tragic 6.2% |
| Sierra Leoneans | 0.0 /100 | #281 | Tragic 6.2% |
| Ecuadorians | 0.0 /100 | #282 | Tragic 6.2% |
| Immigrants | Western Africa | 0.0 /100 | #283 | Tragic 6.2% |
| Spanish American Indians | 0.0 /100 | #284 | Tragic 6.2% |
| Immigrants | Ecuador | 0.0 /100 | #285 | Tragic 6.2% |
| Africans | 0.0 /100 | #286 | Tragic 6.3% |
Demographics Similar to Immigrants from Northern Africa by Male Unemployment
In terms of male unemployment, the demographic groups most similar to Immigrants from Northern Africa are American (5.2%, a difference of 0.030%), Immigrants from Indonesia (5.2%, a difference of 0.050%), Immigrants from Hungary (5.2%, a difference of 0.080%), Indonesian (5.2%, a difference of 0.080%), and Immigrants from Norway (5.2%, a difference of 0.090%).
| Demographics | Rating | Rank | Male Unemployment |
| Indians (Asian) | 76.0 /100 | #150 | Good 5.2% |
| Slovaks | 75.5 /100 | #151 | Good 5.2% |
| Egyptians | 74.8 /100 | #152 | Good 5.2% |
| Immigrants | Uruguay | 73.9 /100 | #153 | Good 5.2% |
| Laotians | 73.8 /100 | #154 | Good 5.2% |
| Immigrants | Hungary | 73.4 /100 | #155 | Good 5.2% |
| Americans | 72.7 /100 | #156 | Good 5.2% |
| Immigrants | Northern Africa | 72.3 /100 | #157 | Good 5.2% |
| Immigrants | Indonesia | 71.5 /100 | #158 | Good 5.2% |
| Indonesians | 71.2 /100 | #159 | Good 5.2% |
| Immigrants | Norway | 71.0 /100 | #160 | Good 5.2% |
| Immigrants | China | 70.6 /100 | #161 | Good 5.2% |
| Immigrants | Egypt | 65.9 /100 | #162 | Good 5.2% |
| Immigrants | Hong Kong | 65.7 /100 | #163 | Good 5.2% |
| Afghans | 62.0 /100 | #164 | Good 5.3% |