Shoshone vs Soviet Union Male Unemployment
COMPARE
Shoshone
Soviet Union
Male Unemployment
Male Unemployment Comparison
Shoshone
Soviet Union
7.6%
MALE UNEMPLOYMENT
0.0/ 100
METRIC RATING
325th/ 347
METRIC RANK
5.6%
MALE UNEMPLOYMENT
3.2/ 100
METRIC RATING
221st/ 347
METRIC RANK
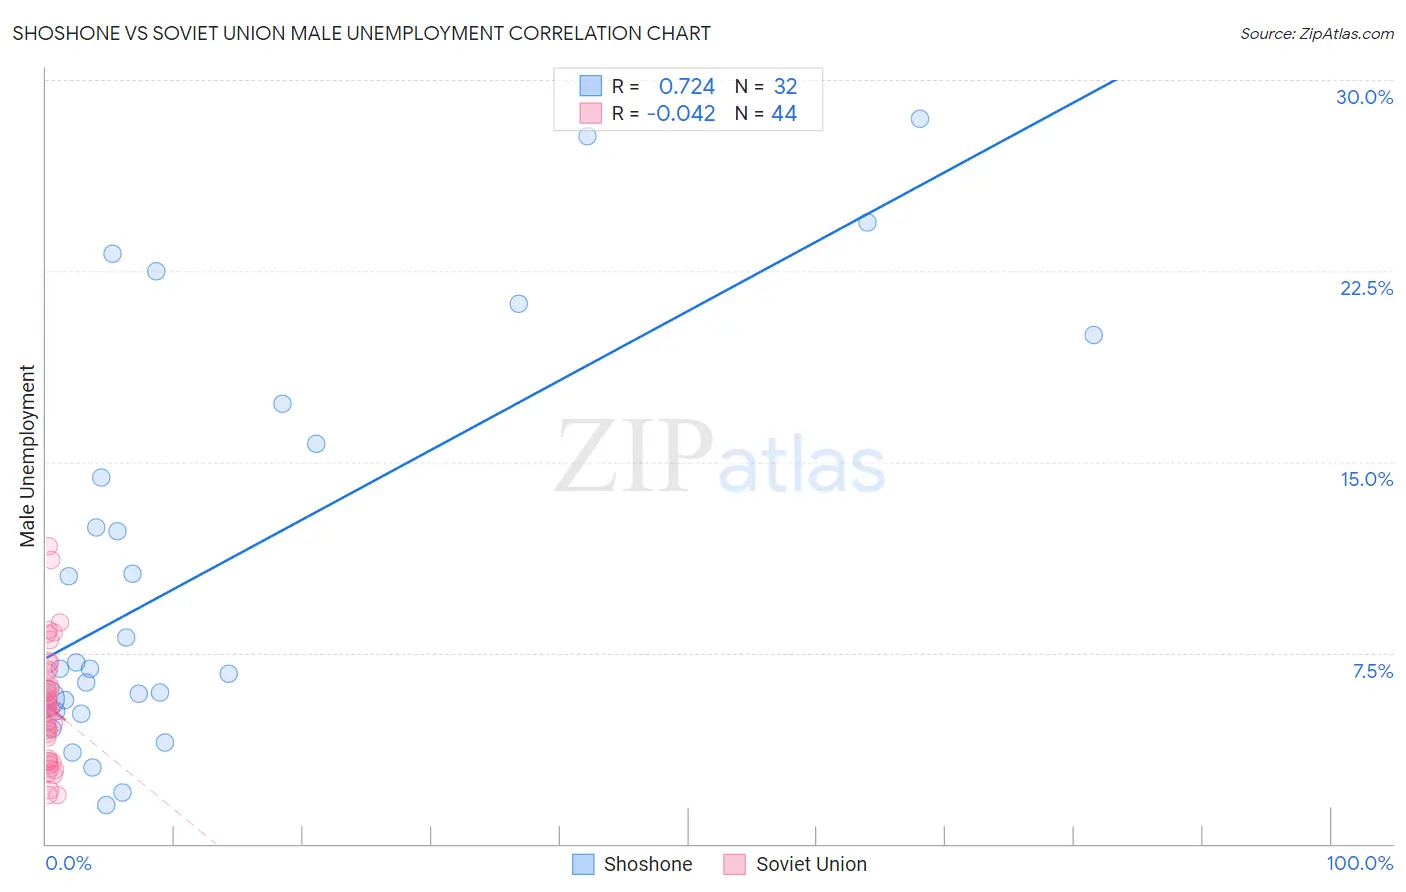
Shoshone vs Soviet Union Male Unemployment Correlation Chart
The statistical analysis conducted on geographies consisting of 66,510,535 people shows a strong positive correlation between the proportion of Shoshone and unemployment rate among males in the United States with a correlation coefficient (R) of 0.724 and weighted average of 7.6%. Similarly, the statistical analysis conducted on geographies consisting of 43,494,943 people shows no correlation between the proportion of Soviet Union and unemployment rate among males in the United States with a correlation coefficient (R) of -0.042 and weighted average of 5.6%, a difference of 36.7%.
Male Unemployment Correlation Summary
| Measurement | Shoshone | Soviet Union |
| Minimum | 1.5% | 1.9% |
| Maximum | 28.5% | 11.7% |
| Range | 27.0% | 9.8% |
| Mean | 11.1% | 5.4% |
| Median | 7.0% | 5.3% |
| Interquartile 25% (IQ1) | 5.4% | 3.3% |
| Interquartile 75% (IQ3) | 16.5% | 6.4% |
| Interquartile Range (IQR) | 11.1% | 3.1% |
| Standard Deviation (Sample) | 8.0% | 2.3% |
| Standard Deviation (Population) | 7.8% | 2.2% |
Similar Demographics by Male Unemployment
Demographics Similar to Shoshone by Male Unemployment
In terms of male unemployment, the demographic groups most similar to Shoshone are Immigrants from Dominican Republic (7.6%, a difference of 0.10%), Dominican (7.6%, a difference of 0.37%), Immigrants from Grenada (7.6%, a difference of 0.65%), Paiute (7.7%, a difference of 1.2%), and Immigrants from Cabo Verde (7.5%, a difference of 1.4%).
| Demographics | Rating | Rank | Male Unemployment |
| Cape Verdeans | 0.0 /100 | #318 | Tragic 7.1% |
| British West Indians | 0.0 /100 | #319 | Tragic 7.3% |
| Colville | 0.0 /100 | #320 | Tragic 7.4% |
| Immigrants | St. Vincent and the Grenadines | 0.0 /100 | #321 | Tragic 7.5% |
| Immigrants | Cabo Verde | 0.0 /100 | #322 | Tragic 7.5% |
| Immigrants | Grenada | 0.0 /100 | #323 | Tragic 7.6% |
| Dominicans | 0.0 /100 | #324 | Tragic 7.6% |
| Shoshone | 0.0 /100 | #325 | Tragic 7.6% |
| Immigrants | Dominican Republic | 0.0 /100 | #326 | Tragic 7.6% |
| Paiute | 0.0 /100 | #327 | Tragic 7.7% |
| Natives/Alaskans | 0.0 /100 | #328 | Tragic 7.7% |
| Immigrants | Yemen | 0.0 /100 | #329 | Tragic 7.8% |
| Yakama | 0.0 /100 | #330 | Tragic 7.9% |
| Alaska Natives | 0.0 /100 | #331 | Tragic 8.1% |
| Pima | 0.0 /100 | #332 | Tragic 8.3% |
Demographics Similar to Soviet Union by Male Unemployment
In terms of male unemployment, the demographic groups most similar to Soviet Union are Portuguese (5.6%, a difference of 0.11%), Immigrants from Western Asia (5.6%, a difference of 0.13%), Immigrants from Micronesia (5.6%, a difference of 0.14%), Immigrants from Albania (5.5%, a difference of 0.18%), and Creek (5.6%, a difference of 0.29%).
| Demographics | Rating | Rank | Male Unemployment |
| Puget Sound Salish | 5.6 /100 | #214 | Tragic 5.5% |
| Samoans | 4.9 /100 | #215 | Tragic 5.5% |
| Immigrants | Immigrants | 4.3 /100 | #216 | Tragic 5.5% |
| Delaware | 4.2 /100 | #217 | Tragic 5.5% |
| Immigrants | Albania | 3.6 /100 | #218 | Tragic 5.5% |
| Immigrants | Western Asia | 3.5 /100 | #219 | Tragic 5.6% |
| Portuguese | 3.5 /100 | #220 | Tragic 5.6% |
| Soviet Union | 3.2 /100 | #221 | Tragic 5.6% |
| Immigrants | Micronesia | 2.9 /100 | #222 | Tragic 5.6% |
| Creek | 2.6 /100 | #223 | Tragic 5.6% |
| Cherokee | 2.4 /100 | #224 | Tragic 5.6% |
| Panamanians | 1.9 /100 | #225 | Tragic 5.6% |
| Immigrants | Cambodia | 1.8 /100 | #226 | Tragic 5.6% |
| Immigrants | Panama | 1.8 /100 | #227 | Tragic 5.6% |
| Seminole | 1.8 /100 | #228 | Tragic 5.6% |