Ghanaian vs Immigrants from Asia Male Unemployment

COMPARE

Ghanaian
Race
Ancestry
AfghanAfricanAlaska NativeAlaskan AthabascanAlbanianAleutAlsatianAmericanApacheArabArapahoArgentineanArmenianAssyrian/Chaldean/SyriacAustralianAustrianBahamianBangladeshiBarbadianBasqueBelgianBelizeanBermudanBhutaneseBlackfeetBolivianBrazilianBritishBritish West IndianBulgarianBurmeseCajunCambodianCanadianCape VerdeanCarpatho RusynCelticCentral AmericanCentral American IndianCherokeeCheyenneChickasawChileanChineseChippewaChoctawColombianColvilleComancheCosta RicanCreeCreekCroatianCrowCubanCypriotCzechCzechoslovakianDanishDelawareDominicanDutchDutch West IndianEastern EuropeanEcuadorianEgyptianEnglishEstonianEthiopianEuropeanFijianFilipinoFinnishFrenchFrench American IndianFrench CanadianGermanGerman RussianGhanaianGreekGuamanian/ChamorroGuatemalanGuyaneseHaitianHmongHonduranHopiHoumaHungarianIcelanderIndian (Asian)IndonesianInupiatIranianIraqiIrishIroquoisIsraeliItalianJamaicanJapaneseJordanianKenyanKiowaKoreanLaotianLatvianLebaneseLiberianLithuanianLumbeeLuxembourgerMacedonianMalaysianMalteseMarshalleseMenomineeMexicanMexican American IndianMongolianMoroccanNative HawaiianNavajoNepaleseNew ZealanderNicaraguanNigerianNorthern EuropeanNorwegianOkinawanOsageOttawaPaiutePakistaniPalestinianPanamanianParaguayanPennsylvania GermanPeruvianPimaPolishPortuguesePotawatomiPuebloPuerto RicanPuget Sound SalishRomanianRussianSalvadoranSamoanScandinavianScotch-IrishScottishSeminoleSenegaleseSerbianShoshoneSierra LeoneanSiouxSlavicSlovakSloveneSomaliSouth AfricanSouth AmericanSouth American IndianSoviet UnionSpaniardSpanishSpanish AmericanSpanish American IndianSri LankanSubsaharan AfricanSudaneseSwedishSwissSyrianTaiwaneseThaiTlingit-HaidaTohono O'OdhamTonganTrinidadian and TobagonianTsimshianTurkishU.S. Virgin IslanderUgandanUkrainianUruguayanUteVenezuelanVietnameseWelshWest IndianYakamaYaquiYugoslavianYumanYup'ikZimbabwean
Immigration
NonimmigrantsImmigrantsAfghanistanAfricaAlbaniaArgentinaArmeniaAustraliaAustriaBahamasBangladeshBarbadosBelarusBelgiumBelizeBoliviaBosnia and HerzegovinaBrazilBulgariaBurma/MyanmarCabo VerdeCambodiaCameroonCanadaCaribbeanCentral AmericaChileChinaColombiaCongoCosta RicaCroatiaCubaCzechoslovakiaDenmarkDominicaDominican RepublicEastern AfricaEastern AsiaEastern EuropeEcuadorEgyptEl SalvadorEnglandEritreaEthiopiaEuropeFijiFranceGermanyGhanaGreeceGrenadaGuatemalaGuyanaHaitiHondurasHong KongHungaryIndiaIndonesiaIranIraqIrelandIsraelItalyJamaicaJapanJordanKazakhstanKenyaKoreaKuwaitLaosLatin AmericaLatviaLebanonLiberiaLithuaniaMalaysiaMexicoMicronesiaMiddle AfricaMoldovaMoroccoNepalNetherlandsNicaraguaNigeriaNorth AmericaNorth MacedoniaNorthern AfricaNorthern EuropeNorwayOceaniaPakistanPanamaPeruPhilippinesPolandPortugalRomaniaRussiaSaudi ArabiaScotlandSenegalSerbiaSierra LeoneSingaporeSomaliaSouth AfricaSouth AmericaSouth Central AsiaSouth Eastern AsiaSouthern EuropeSpainSri LankaSt. Vincent and the GrenadinesSudanSwedenSwitzerlandSyriaTaiwanThailandTrinidad and TobagoTurkeyUgandaUkraineUruguayUzbekistanVenezuelaVietnamWest IndiesWestern AfricaWestern AsiaWestern EuropeYemenZaireZimbabweAzores
Immigrants from Asia
Race
Ancestry
AfghanAfricanAlaska NativeAlaskan AthabascanAlbanianAleutAlsatianAmericanApacheArabArapahoArgentineanArmenianAssyrian/Chaldean/SyriacAustralianAustrianBahamianBangladeshiBarbadianBasqueBelgianBelizeanBermudanBhutaneseBlackfeetBolivianBrazilianBritishBritish West IndianBulgarianBurmeseCajunCambodianCanadianCape VerdeanCarpatho RusynCelticCentral AmericanCentral American IndianCherokeeCheyenneChickasawChileanChineseChippewaChoctawColombianColvilleComancheCosta RicanCreeCreekCroatianCrowCubanCypriotCzechCzechoslovakianDanishDelawareDominicanDutchDutch West IndianEastern EuropeanEcuadorianEgyptianEnglishEstonianEthiopianEuropeanFijianFilipinoFinnishFrenchFrench American IndianFrench CanadianGermanGerman RussianGreekGuamanian/ChamorroGuatemalanGuyaneseHaitianHmongHonduranHopiHoumaHungarianIcelanderIndian (Asian)IndonesianInupiatIranianIraqiIrishIroquoisIsraeliItalianJamaicanJapaneseJordanianKenyanKiowaKoreanLaotianLatvianLebaneseLiberianLithuanianLumbeeLuxembourgerMacedonianMalaysianMalteseMarshalleseMenomineeMexicanMexican American IndianMongolianMoroccanNative HawaiianNavajoNepaleseNew ZealanderNicaraguanNigerianNorthern EuropeanNorwegianOkinawanOsageOttawaPaiutePakistaniPalestinianPanamanianParaguayanPennsylvania GermanPeruvianPimaPolishPortuguesePotawatomiPuebloPuerto RicanPuget Sound SalishRomanianRussianSalvadoranSamoanScandinavianScotch-IrishScottishSeminoleSenegaleseSerbianShoshoneSierra LeoneanSiouxSlavicSlovakSloveneSomaliSouth AfricanSouth AmericanSouth American IndianSoviet UnionSpaniardSpanishSpanish AmericanSpanish American IndianSri LankanSubsaharan AfricanSudaneseSwedishSwissSyrianTaiwaneseThaiTlingit-HaidaTohono O'OdhamTonganTrinidadian and TobagonianTsimshianTurkishU.S. Virgin IslanderUgandanUkrainianUruguayanUteVenezuelanVietnameseWelshWest IndianYakamaYaquiYugoslavianYumanYup'ikZimbabwean
Immigration
NonimmigrantsImmigrantsAfghanistanAfricaAlbaniaArgentinaArmeniaAsiaAustraliaAustriaBahamasBangladeshBarbadosBelarusBelgiumBelizeBoliviaBosnia and HerzegovinaBrazilBulgariaBurma/MyanmarCabo VerdeCambodiaCameroonCanadaCaribbeanCentral AmericaChileChinaColombiaCongoCosta RicaCroatiaCubaCzechoslovakiaDenmarkDominicaDominican RepublicEastern AfricaEastern AsiaEastern EuropeEcuadorEgyptEl SalvadorEnglandEritreaEthiopiaEuropeFijiFranceGermanyGhanaGreeceGrenadaGuatemalaGuyanaHaitiHondurasHong KongHungaryIndiaIndonesiaIranIraqIrelandIsraelItalyJamaicaJapanJordanKazakhstanKenyaKoreaKuwaitLaosLatin AmericaLatviaLebanonLiberiaLithuaniaMalaysiaMexicoMicronesiaMiddle AfricaMoldovaMoroccoNepalNetherlandsNicaraguaNigeriaNorth AmericaNorth MacedoniaNorthern AfricaNorthern EuropeNorwayOceaniaPakistanPanamaPeruPhilippinesPolandPortugalRomaniaRussiaSaudi ArabiaScotlandSenegalSerbiaSierra LeoneSingaporeSomaliaSouth AfricaSouth AmericaSouth Central AsiaSouth Eastern AsiaSouthern EuropeSpainSri LankaSt. Vincent and the GrenadinesSudanSwedenSwitzerlandSyriaTaiwanThailandTrinidad and TobagoTurkeyUgandaUkraineUruguayUzbekistanVenezuelaVietnamWest IndiesWestern AfricaWestern AsiaWestern EuropeYemenZaireZimbabweAzores
Male Unemployment
Income
Poverty
Unemployment
Labor Participation
Family Structure
Vehicle Availability
Education Level
Disability

Male Unemployment Comparison

Ghanaians

Immigrants from Asia

Tragic
Excellent
6.1%
MALE UNEMPLOYMENT
0.0/ 100
METRIC RATING
279th/ 347
METRIC RANK
5.1%
MALE UNEMPLOYMENT
89.6/ 100
METRIC RATING
115th/ 347
METRIC RANK

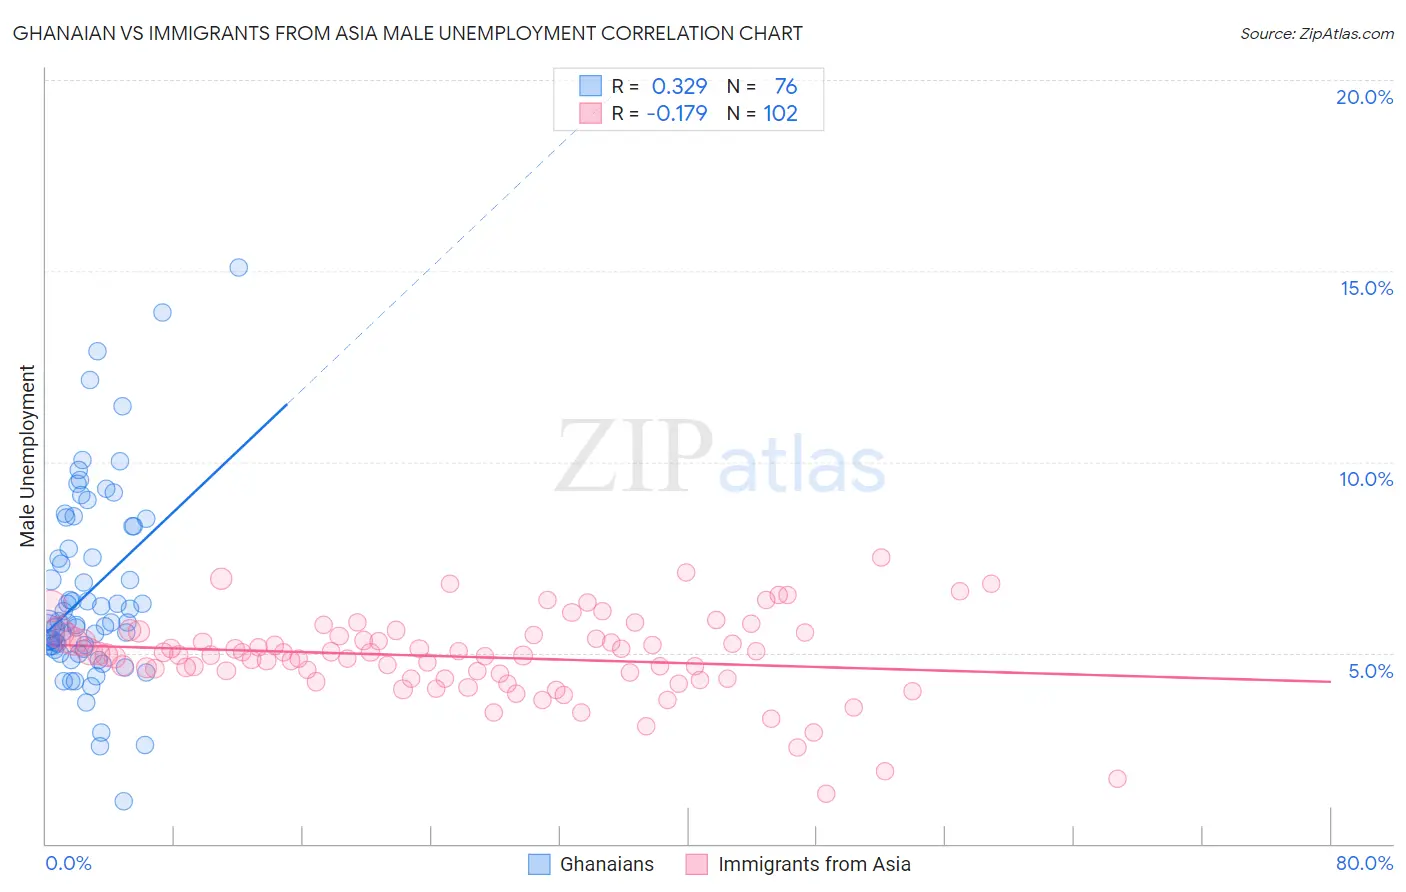
Ghanaian vs Immigrants from Asia Male Unemployment Correlation Chart

The statistical analysis conducted on geographies consisting of 190,397,000 people shows a mild positive correlation between the proportion of Ghanaians and unemployment rate among males in the United States with a correlation coefficient (R) of 0.329 and weighted average of 6.1%. Similarly, the statistical analysis conducted on geographies consisting of 542,340,626 people shows a poor negative correlation between the proportion of Immigrants from Asia and unemployment rate among males in the United States with a correlation coefficient (R) of -0.179 and weighted average of 5.1%, a difference of 18.8%.
Ghanaian vs Immigrants from Asia Male Unemployment

Male Unemployment Correlation Summary

MeasurementGhanaianImmigrants from Asia
Minimum1.1%1.3%
Maximum15.1%7.5%
Range14.0%6.2%
Mean6.6%4.9%
Median5.8%5.0%
Interquartile 25% (IQ1)5.1%4.3%
Interquartile 75% (IQ3)8.3%5.4%
Interquartile Range (IQR)3.2%1.1%
Standard Deviation (Sample)2.6%1.1%
Standard Deviation (Population)2.5%1.1%

Similar Demographics by Male Unemployment

Demographics Similar to Ghanaians by Male Unemployment

In terms of male unemployment, the demographic groups most similar to Ghanaians are Immigrants from Fiji (6.1%, a difference of 0.50%), Immigrants from Liberia (6.1%, a difference of 0.62%), Immigrants from Ghana (6.2%, a difference of 0.99%), Tlingit-Haida (6.0%, a difference of 1.1%), and Sierra Leonean (6.2%, a difference of 1.1%).
DemographicsRating | RankMale Unemployment
Immigrants | Uzbekistan
0.0
/100
|
#272
Tragic
6.0%
Armenians
0.0
/100
|
#273
Tragic
6.0%
Immigrants | Sierra Leone
0.0
/100
|
#274
Tragic
6.0%
Menominee
0.0
/100
|
#275
Tragic
6.0%
Tlingit-Haida
0.0
/100
|
#276
Tragic
6.0%
Immigrants | Liberia
0.0
/100
|
#277
Tragic
6.1%
Immigrants | Fiji
0.0
/100
|
#278
Tragic
6.1%
Ghanaians
0.0
/100
|
#279
Tragic
6.1%
Immigrants | Ghana
0.0
/100
|
#280
Tragic
6.2%
Sierra Leoneans
0.0
/100
|
#281
Tragic
6.2%
Ecuadorians
0.0
/100
|
#282
Tragic
6.2%
Immigrants | Western Africa
0.0
/100
|
#283
Tragic
6.2%
Spanish American Indians
0.0
/100
|
#284
Tragic
6.2%
Immigrants | Ecuador
0.0
/100
|
#285
Tragic
6.2%
Africans
0.0
/100
|
#286
Tragic
6.3%

Demographics Similar to Immigrants from Asia by Male Unemployment

In terms of male unemployment, the demographic groups most similar to Immigrants from Asia are Romanian (5.1%, a difference of 0.030%), Immigrants from Denmark (5.1%, a difference of 0.040%), Estonian (5.1%, a difference of 0.090%), Immigrants from Moldova (5.1%, a difference of 0.11%), and Immigrants from Austria (5.1%, a difference of 0.11%).
DemographicsRating | RankMale Unemployment
Immigrants | Nicaragua
91.2
/100
|
#108
Exceptional
5.1%
Immigrants | Pakistan
90.9
/100
|
#109
Exceptional
5.1%
Immigrants | England
90.8
/100
|
#110
Exceptional
5.1%
Immigrants | Eastern Asia
90.8
/100
|
#111
Exceptional
5.1%
Immigrants | Moldova
90.3
/100
|
#112
Exceptional
5.1%
Immigrants | Austria
90.3
/100
|
#113
Exceptional
5.1%
Romanians
89.8
/100
|
#114
Excellent
5.1%
Immigrants | Asia
89.6
/100
|
#115
Excellent
5.1%
Immigrants | Denmark
89.4
/100
|
#116
Excellent
5.1%
Estonians
89.0
/100
|
#117
Excellent
5.1%
Cypriots
88.8
/100
|
#118
Excellent
5.1%
French Canadians
88.6
/100
|
#119
Excellent
5.1%
Ukrainians
88.4
/100
|
#120
Excellent
5.1%
Mongolians
88.4
/100
|
#121
Excellent
5.1%
Nicaraguans
88.2
/100
|
#122
Excellent
5.1%