Immigrants from Philippines vs Soviet Union Male Unemployment
COMPARE
Immigrants from Philippines
Soviet Union
Male Unemployment
Male Unemployment Comparison
Immigrants from Philippines
Soviet Union
5.4%
MALE UNEMPLOYMENT
13.5/ 100
METRIC RATING
201st/ 347
METRIC RANK
5.6%
MALE UNEMPLOYMENT
3.2/ 100
METRIC RATING
221st/ 347
METRIC RANK
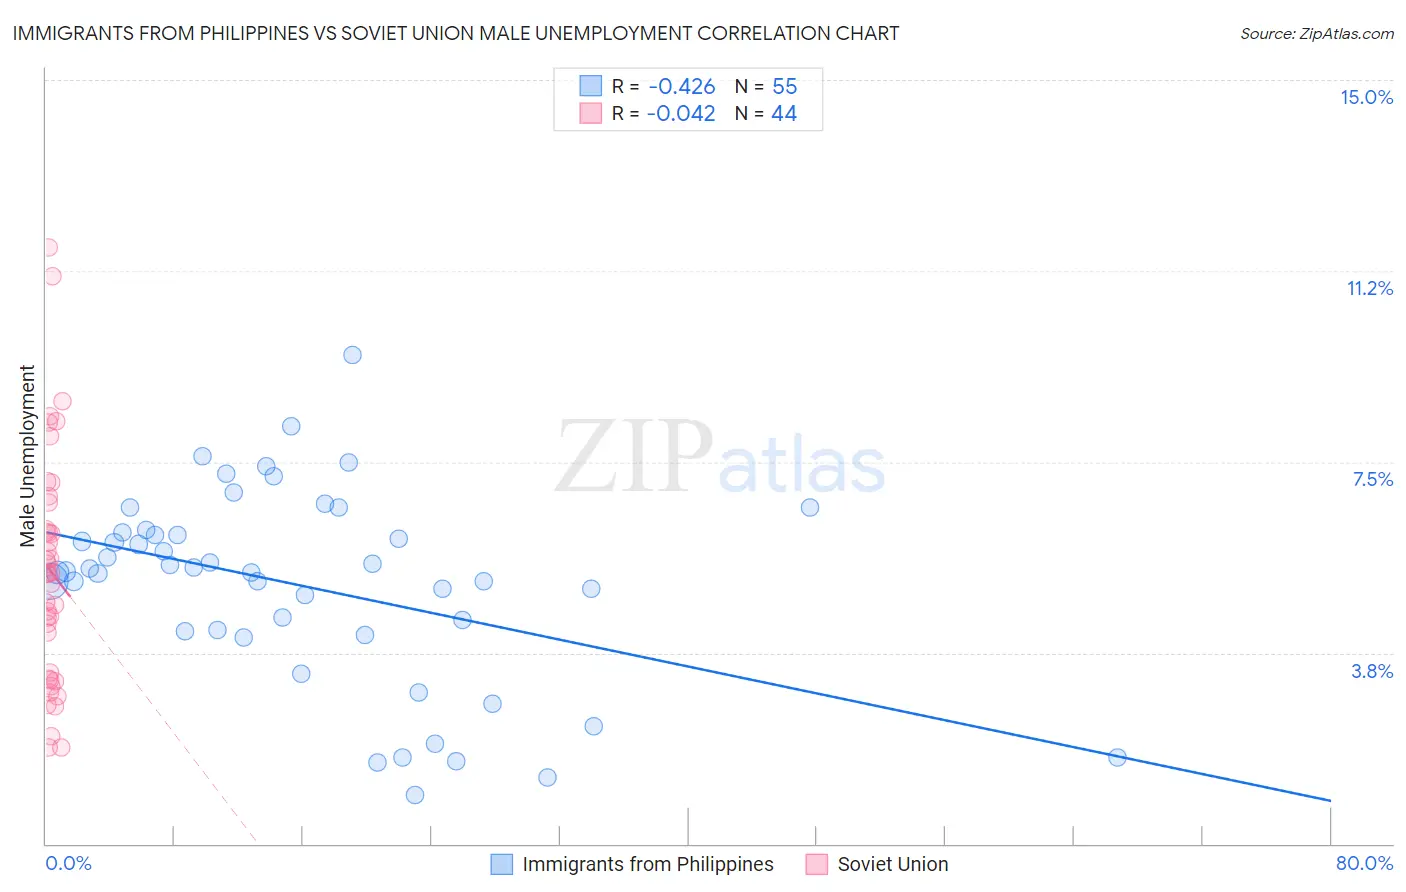
Immigrants from Philippines vs Soviet Union Male Unemployment Correlation Chart
The statistical analysis conducted on geographies consisting of 468,596,641 people shows a moderate negative correlation between the proportion of Immigrants from Philippines and unemployment rate among males in the United States with a correlation coefficient (R) of -0.426 and weighted average of 5.4%. Similarly, the statistical analysis conducted on geographies consisting of 43,494,943 people shows no correlation between the proportion of Soviet Union and unemployment rate among males in the United States with a correlation coefficient (R) of -0.042 and weighted average of 5.6%, a difference of 2.2%.
Male Unemployment Correlation Summary
| Measurement | Immigrants from Philippines | Soviet Union |
| Minimum | 0.95% | 1.9% |
| Maximum | 9.6% | 11.7% |
| Range | 8.6% | 9.8% |
| Mean | 5.1% | 5.4% |
| Median | 5.3% | 5.3% |
| Interquartile 25% (IQ1) | 4.2% | 3.3% |
| Interquartile 75% (IQ3) | 6.1% | 6.4% |
| Interquartile Range (IQR) | 1.9% | 3.1% |
| Standard Deviation (Sample) | 1.9% | 2.3% |
| Standard Deviation (Population) | 1.9% | 2.2% |
Demographics Similar to Immigrants from Philippines and Soviet Union by Male Unemployment
In terms of male unemployment, the demographic groups most similar to Immigrants from Philippines are Nonimmigrants (5.4%, a difference of 0.040%), Immigrants from Laos (5.4%, a difference of 0.050%), Guamanian/Chamorro (5.4%, a difference of 0.15%), Immigrants from Costa Rica (5.5%, a difference of 0.27%), and Immigrants from Ukraine (5.5%, a difference of 0.49%). Similarly, the demographic groups most similar to Soviet Union are Portuguese (5.6%, a difference of 0.11%), Immigrants from Western Asia (5.6%, a difference of 0.13%), Immigrants from Albania (5.5%, a difference of 0.18%), Delaware (5.5%, a difference of 0.39%), and Immigrants (5.5%, a difference of 0.44%).
| Demographics | Rating | Rank | Male Unemployment |
| Immigrants | Philippines | 13.5 /100 | #201 | Poor 5.4% |
| Immigrants | Nonimmigrants | 13.1 /100 | #202 | Poor 5.4% |
| Immigrants | Laos | 13.0 /100 | #203 | Poor 5.4% |
| Guamanians/Chamorros | 12.3 /100 | #204 | Poor 5.4% |
| Immigrants | Costa Rica | 11.4 /100 | #205 | Poor 5.5% |
| Immigrants | Ukraine | 9.9 /100 | #206 | Tragic 5.5% |
| Immigrants | Syria | 9.3 /100 | #207 | Tragic 5.5% |
| Immigrants | Lebanon | 8.6 /100 | #208 | Tragic 5.5% |
| Immigrants | Middle Africa | 8.3 /100 | #209 | Tragic 5.5% |
| South American Indians | 7.6 /100 | #210 | Tragic 5.5% |
| Israelis | 7.4 /100 | #211 | Tragic 5.5% |
| Hmong | 7.0 /100 | #212 | Tragic 5.5% |
| Ugandans | 6.3 /100 | #213 | Tragic 5.5% |
| Puget Sound Salish | 5.6 /100 | #214 | Tragic 5.5% |
| Samoans | 4.9 /100 | #215 | Tragic 5.5% |
| Immigrants | Immigrants | 4.3 /100 | #216 | Tragic 5.5% |
| Delaware | 4.2 /100 | #217 | Tragic 5.5% |
| Immigrants | Albania | 3.6 /100 | #218 | Tragic 5.5% |
| Immigrants | Western Asia | 3.5 /100 | #219 | Tragic 5.6% |
| Portuguese | 3.5 /100 | #220 | Tragic 5.6% |
| Soviet Union | 3.2 /100 | #221 | Tragic 5.6% |