Spanish vs Immigrants from Northern Africa Male Unemployment
COMPARE
Spanish
Immigrants from Northern Africa
Male Unemployment
Male Unemployment Comparison
Spanish
Immigrants from Northern Africa
5.4%
MALE UNEMPLOYMENT
19.7/ 100
METRIC RATING
194th/ 347
METRIC RANK
5.2%
MALE UNEMPLOYMENT
72.3/ 100
METRIC RATING
157th/ 347
METRIC RANK
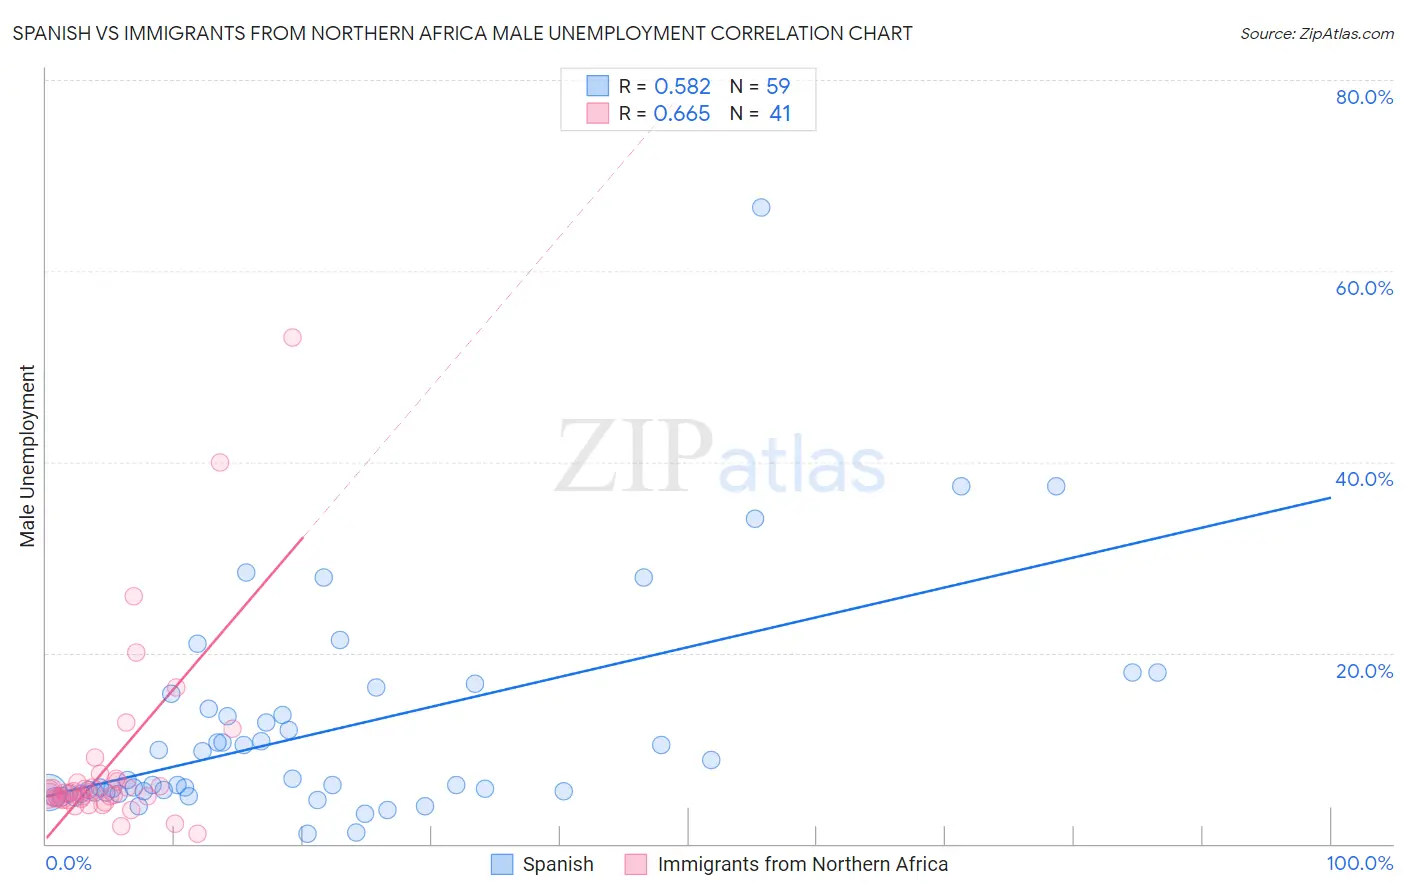
Spanish vs Immigrants from Northern Africa Male Unemployment Correlation Chart
The statistical analysis conducted on geographies consisting of 419,777,027 people shows a substantial positive correlation between the proportion of Spanish and unemployment rate among males in the United States with a correlation coefficient (R) of 0.582 and weighted average of 5.4%. Similarly, the statistical analysis conducted on geographies consisting of 320,554,315 people shows a significant positive correlation between the proportion of Immigrants from Northern Africa and unemployment rate among males in the United States with a correlation coefficient (R) of 0.665 and weighted average of 5.2%, a difference of 3.5%.
Male Unemployment Correlation Summary
| Measurement | Spanish | Immigrants from Northern Africa |
| Minimum | 1.1% | 1.1% |
| Maximum | 66.7% | 53.0% |
| Range | 65.6% | 51.9% |
| Mean | 11.8% | 8.6% |
| Median | 6.2% | 5.3% |
| Interquartile 25% (IQ1) | 5.3% | 4.7% |
| Interquartile 75% (IQ3) | 14.1% | 6.7% |
| Interquartile Range (IQR) | 8.8% | 2.0% |
| Standard Deviation (Sample) | 11.4% | 10.0% |
| Standard Deviation (Population) | 11.3% | 9.9% |
Similar Demographics by Male Unemployment
Demographics Similar to Spanish by Male Unemployment
In terms of male unemployment, the demographic groups most similar to Spanish are Immigrants from Southern Europe (5.4%, a difference of 0.18%), Albanian (5.4%, a difference of 0.22%), Alsatian (5.4%, a difference of 0.28%), Immigrants from Israel (5.4%, a difference of 0.46%), and Immigrants from Thailand (5.4%, a difference of 0.50%).
| Demographics | Rating | Rank | Male Unemployment |
| Costa Ricans | 31.3 /100 | #187 | Fair 5.4% |
| Arabs | 30.2 /100 | #188 | Fair 5.4% |
| Immigrants | South America | 29.4 /100 | #189 | Fair 5.4% |
| Immigrants | Uganda | 28.8 /100 | #190 | Fair 5.4% |
| Immigrants | South Eastern Asia | 28.2 /100 | #191 | Fair 5.4% |
| Immigrants | Belarus | 26.0 /100 | #192 | Fair 5.4% |
| Immigrants | Israel | 25.2 /100 | #193 | Fair 5.4% |
| Spanish | 19.7 /100 | #194 | Poor 5.4% |
| Immigrants | Southern Europe | 17.7 /100 | #195 | Poor 5.4% |
| Albanians | 17.3 /100 | #196 | Poor 5.4% |
| Alsatians | 16.7 /100 | #197 | Poor 5.4% |
| Immigrants | Thailand | 14.7 /100 | #198 | Poor 5.4% |
| Immigrants | Greece | 14.5 /100 | #199 | Poor 5.4% |
| Immigrants | Zaire | 13.7 /100 | #200 | Poor 5.4% |
| Immigrants | Philippines | 13.5 /100 | #201 | Poor 5.4% |
Demographics Similar to Immigrants from Northern Africa by Male Unemployment
In terms of male unemployment, the demographic groups most similar to Immigrants from Northern Africa are American (5.2%, a difference of 0.030%), Immigrants from Indonesia (5.2%, a difference of 0.050%), Immigrants from Hungary (5.2%, a difference of 0.080%), Indonesian (5.2%, a difference of 0.080%), and Immigrants from Norway (5.2%, a difference of 0.090%).
| Demographics | Rating | Rank | Male Unemployment |
| Indians (Asian) | 76.0 /100 | #150 | Good 5.2% |
| Slovaks | 75.5 /100 | #151 | Good 5.2% |
| Egyptians | 74.8 /100 | #152 | Good 5.2% |
| Immigrants | Uruguay | 73.9 /100 | #153 | Good 5.2% |
| Laotians | 73.8 /100 | #154 | Good 5.2% |
| Immigrants | Hungary | 73.4 /100 | #155 | Good 5.2% |
| Americans | 72.7 /100 | #156 | Good 5.2% |
| Immigrants | Northern Africa | 72.3 /100 | #157 | Good 5.2% |
| Immigrants | Indonesia | 71.5 /100 | #158 | Good 5.2% |
| Indonesians | 71.2 /100 | #159 | Good 5.2% |
| Immigrants | Norway | 71.0 /100 | #160 | Good 5.2% |
| Immigrants | China | 70.6 /100 | #161 | Good 5.2% |
| Immigrants | Egypt | 65.9 /100 | #162 | Good 5.2% |
| Immigrants | Hong Kong | 65.7 /100 | #163 | Good 5.2% |
| Afghans | 62.0 /100 | #164 | Good 5.3% |