German Russian vs Immigrants from Northern Africa Male Unemployment
COMPARE
German Russian
Immigrants from Northern Africa
Male Unemployment
Male Unemployment Comparison
German Russians
Immigrants from Northern Africa
5.1%
MALE UNEMPLOYMENT
92.7/ 100
METRIC RATING
101st/ 347
METRIC RANK
5.2%
MALE UNEMPLOYMENT
72.3/ 100
METRIC RATING
157th/ 347
METRIC RANK
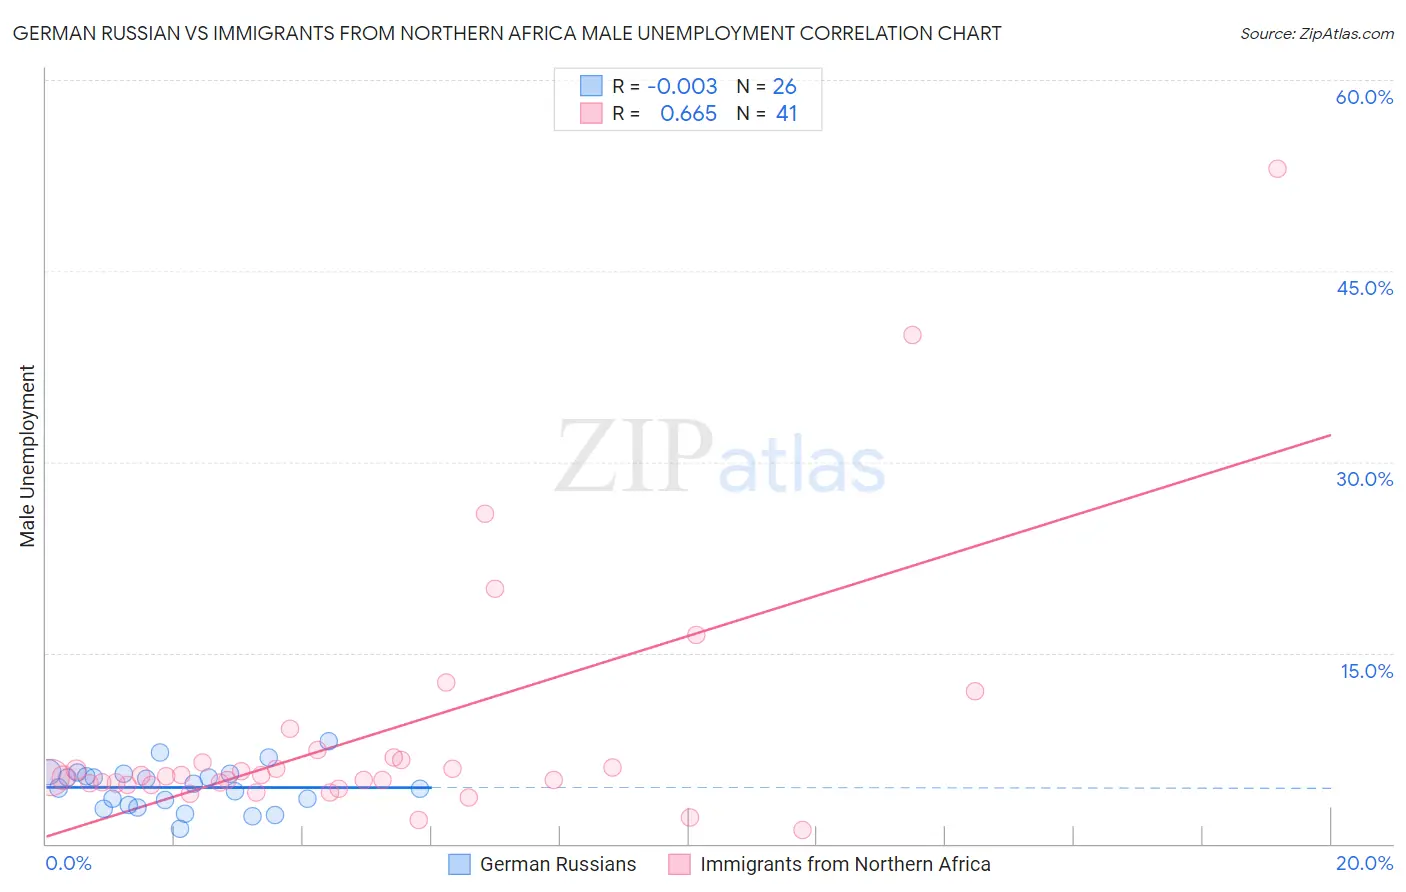
German Russian vs Immigrants from Northern Africa Male Unemployment Correlation Chart
The statistical analysis conducted on geographies consisting of 96,273,571 people shows no correlation between the proportion of German Russians and unemployment rate among males in the United States with a correlation coefficient (R) of -0.003 and weighted average of 5.1%. Similarly, the statistical analysis conducted on geographies consisting of 320,554,315 people shows a significant positive correlation between the proportion of Immigrants from Northern Africa and unemployment rate among males in the United States with a correlation coefficient (R) of 0.665 and weighted average of 5.2%, a difference of 2.4%.
Male Unemployment Correlation Summary
| Measurement | German Russian | Immigrants from Northern Africa |
| Minimum | 1.2% | 1.1% |
| Maximum | 8.1% | 53.0% |
| Range | 6.9% | 51.9% |
| Mean | 4.4% | 8.6% |
| Median | 4.6% | 5.3% |
| Interquartile 25% (IQ1) | 3.0% | 4.7% |
| Interquartile 75% (IQ3) | 5.5% | 6.7% |
| Interquartile Range (IQR) | 2.5% | 2.0% |
| Standard Deviation (Sample) | 1.7% | 10.0% |
| Standard Deviation (Population) | 1.6% | 9.9% |
Similar Demographics by Male Unemployment
Demographics Similar to German Russians by Male Unemployment
In terms of male unemployment, the demographic groups most similar to German Russians are Immigrants from France (5.1%, a difference of 0.020%), Russian (5.1%, a difference of 0.040%), Uruguayan (5.1%, a difference of 0.060%), Immigrants from Kuwait (5.1%, a difference of 0.12%), and Immigrants from Spain (5.1%, a difference of 0.16%).
| Demographics | Rating | Rank | Male Unemployment |
| Canadians | 94.1 /100 | #94 | Exceptional 5.1% |
| Italians | 93.8 /100 | #95 | Exceptional 5.1% |
| Asians | 93.7 /100 | #96 | Exceptional 5.1% |
| Immigrants | Spain | 93.4 /100 | #97 | Exceptional 5.1% |
| Immigrants | Kuwait | 93.3 /100 | #98 | Exceptional 5.1% |
| Uruguayans | 93.0 /100 | #99 | Exceptional 5.1% |
| Russians | 92.9 /100 | #100 | Exceptional 5.1% |
| German Russians | 92.7 /100 | #101 | Exceptional 5.1% |
| Immigrants | France | 92.7 /100 | #102 | Exceptional 5.1% |
| Immigrants | Jordan | 91.9 /100 | #103 | Exceptional 5.1% |
| Immigrants | Chile | 91.8 /100 | #104 | Exceptional 5.1% |
| Immigrants | Czechoslovakia | 91.7 /100 | #105 | Exceptional 5.1% |
| Immigrants | Ethiopia | 91.5 /100 | #106 | Exceptional 5.1% |
| Ethiopians | 91.3 /100 | #107 | Exceptional 5.1% |
| Immigrants | Nicaragua | 91.2 /100 | #108 | Exceptional 5.1% |
Demographics Similar to Immigrants from Northern Africa by Male Unemployment
In terms of male unemployment, the demographic groups most similar to Immigrants from Northern Africa are American (5.2%, a difference of 0.030%), Immigrants from Indonesia (5.2%, a difference of 0.050%), Immigrants from Hungary (5.2%, a difference of 0.080%), Indonesian (5.2%, a difference of 0.080%), and Immigrants from Norway (5.2%, a difference of 0.090%).
| Demographics | Rating | Rank | Male Unemployment |
| Indians (Asian) | 76.0 /100 | #150 | Good 5.2% |
| Slovaks | 75.5 /100 | #151 | Good 5.2% |
| Egyptians | 74.8 /100 | #152 | Good 5.2% |
| Immigrants | Uruguay | 73.9 /100 | #153 | Good 5.2% |
| Laotians | 73.8 /100 | #154 | Good 5.2% |
| Immigrants | Hungary | 73.4 /100 | #155 | Good 5.2% |
| Americans | 72.7 /100 | #156 | Good 5.2% |
| Immigrants | Northern Africa | 72.3 /100 | #157 | Good 5.2% |
| Immigrants | Indonesia | 71.5 /100 | #158 | Good 5.2% |
| Indonesians | 71.2 /100 | #159 | Good 5.2% |
| Immigrants | Norway | 71.0 /100 | #160 | Good 5.2% |
| Immigrants | China | 70.6 /100 | #161 | Good 5.2% |
| Immigrants | Egypt | 65.9 /100 | #162 | Good 5.2% |
| Immigrants | Hong Kong | 65.7 /100 | #163 | Good 5.2% |
| Afghans | 62.0 /100 | #164 | Good 5.3% |