Thai vs Immigrants from Northern Africa Male Unemployment
COMPARE
Thai
Immigrants from Northern Africa
Male Unemployment
Male Unemployment Comparison
Thais
Immigrants from Northern Africa
4.6%
MALE UNEMPLOYMENT
100.0/ 100
METRIC RATING
9th/ 347
METRIC RANK
5.2%
MALE UNEMPLOYMENT
72.3/ 100
METRIC RATING
157th/ 347
METRIC RANK
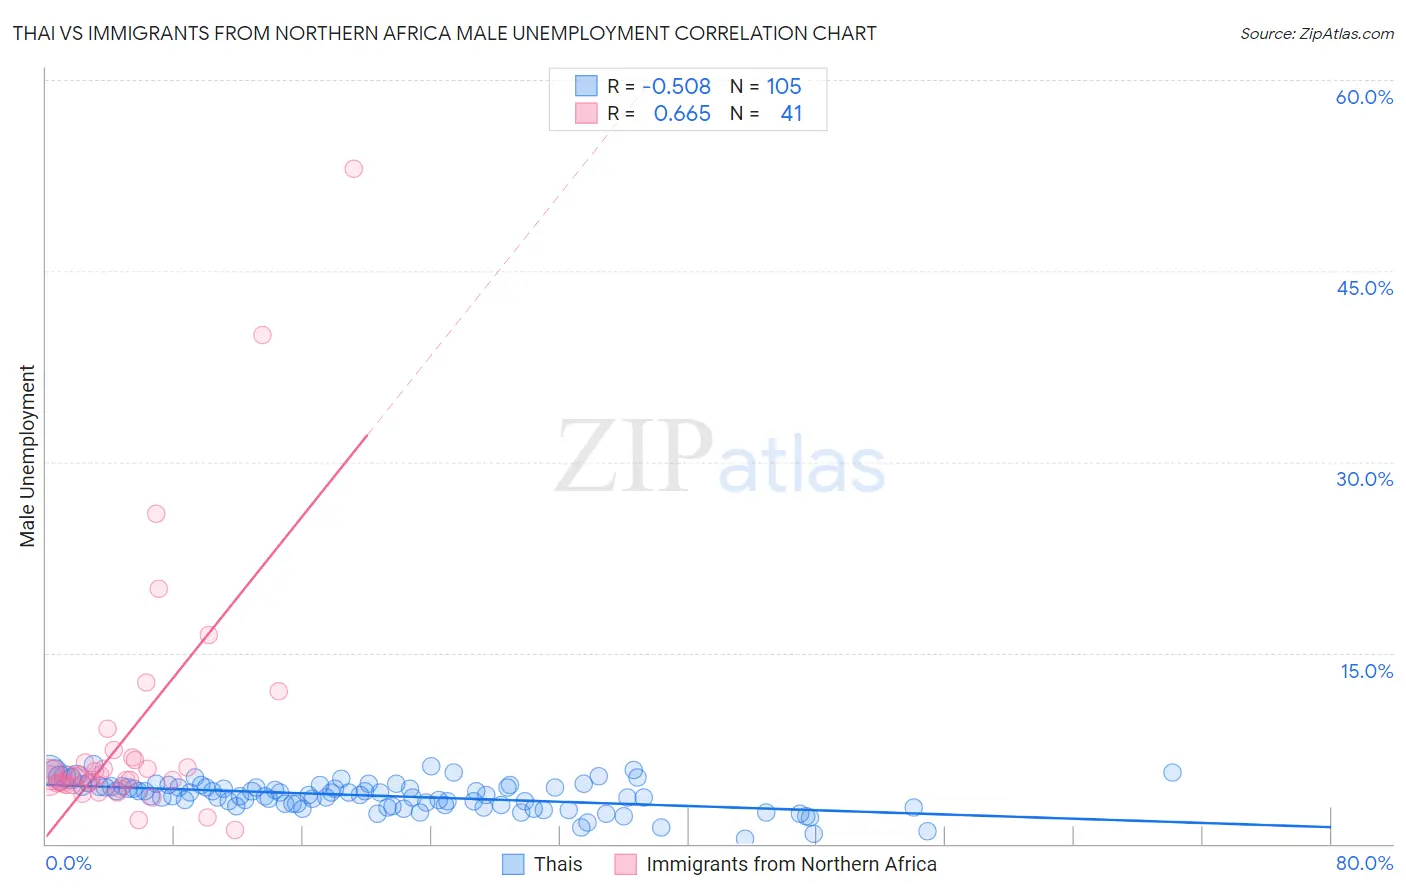
Thai vs Immigrants from Northern Africa Male Unemployment Correlation Chart
The statistical analysis conducted on geographies consisting of 473,148,308 people shows a substantial negative correlation between the proportion of Thais and unemployment rate among males in the United States with a correlation coefficient (R) of -0.508 and weighted average of 4.6%. Similarly, the statistical analysis conducted on geographies consisting of 320,554,315 people shows a significant positive correlation between the proportion of Immigrants from Northern Africa and unemployment rate among males in the United States with a correlation coefficient (R) of 0.665 and weighted average of 5.2%, a difference of 13.7%.
Male Unemployment Correlation Summary
| Measurement | Thai | Immigrants from Northern Africa |
| Minimum | 0.40% | 1.1% |
| Maximum | 6.2% | 53.0% |
| Range | 5.8% | 51.9% |
| Mean | 3.8% | 8.6% |
| Median | 3.8% | 5.3% |
| Interquartile 25% (IQ1) | 3.0% | 4.7% |
| Interquartile 75% (IQ3) | 4.5% | 6.7% |
| Interquartile Range (IQR) | 1.5% | 2.0% |
| Standard Deviation (Sample) | 1.2% | 10.0% |
| Standard Deviation (Population) | 1.1% | 9.9% |
Similar Demographics by Male Unemployment
Demographics Similar to Thais by Male Unemployment
In terms of male unemployment, the demographic groups most similar to Thais are Cuban (4.6%, a difference of 0.60%), Swedish (4.6%, a difference of 0.81%), Luxembourger (4.5%, a difference of 1.2%), Czech (4.5%, a difference of 1.5%), and Immigrants from Bolivia (4.7%, a difference of 1.5%).
| Demographics | Rating | Rank | Male Unemployment |
| Immigrants | Cuba | 100.0 /100 | #2 | Exceptional 4.4% |
| Norwegians | 100.0 /100 | #3 | Exceptional 4.4% |
| Immigrants | Venezuela | 100.0 /100 | #4 | Exceptional 4.4% |
| Danes | 100.0 /100 | #5 | Exceptional 4.5% |
| Venezuelans | 100.0 /100 | #6 | Exceptional 4.5% |
| Czechs | 100.0 /100 | #7 | Exceptional 4.5% |
| Luxembourgers | 100.0 /100 | #8 | Exceptional 4.5% |
| Thais | 100.0 /100 | #9 | Exceptional 4.6% |
| Cubans | 100.0 /100 | #10 | Exceptional 4.6% |
| Swedes | 100.0 /100 | #11 | Exceptional 4.6% |
| Immigrants | Bolivia | 100.0 /100 | #12 | Exceptional 4.7% |
| Bolivians | 100.0 /100 | #13 | Exceptional 4.7% |
| Germans | 100.0 /100 | #14 | Exceptional 4.7% |
| Scandinavians | 100.0 /100 | #15 | Exceptional 4.7% |
| Swiss | 99.9 /100 | #16 | Exceptional 4.7% |
Demographics Similar to Immigrants from Northern Africa by Male Unemployment
In terms of male unemployment, the demographic groups most similar to Immigrants from Northern Africa are American (5.2%, a difference of 0.030%), Immigrants from Indonesia (5.2%, a difference of 0.050%), Immigrants from Hungary (5.2%, a difference of 0.080%), Indonesian (5.2%, a difference of 0.080%), and Immigrants from Norway (5.2%, a difference of 0.090%).
| Demographics | Rating | Rank | Male Unemployment |
| Indians (Asian) | 76.0 /100 | #150 | Good 5.2% |
| Slovaks | 75.5 /100 | #151 | Good 5.2% |
| Egyptians | 74.8 /100 | #152 | Good 5.2% |
| Immigrants | Uruguay | 73.9 /100 | #153 | Good 5.2% |
| Laotians | 73.8 /100 | #154 | Good 5.2% |
| Immigrants | Hungary | 73.4 /100 | #155 | Good 5.2% |
| Americans | 72.7 /100 | #156 | Good 5.2% |
| Immigrants | Northern Africa | 72.3 /100 | #157 | Good 5.2% |
| Immigrants | Indonesia | 71.5 /100 | #158 | Good 5.2% |
| Indonesians | 71.2 /100 | #159 | Good 5.2% |
| Immigrants | Norway | 71.0 /100 | #160 | Good 5.2% |
| Immigrants | China | 70.6 /100 | #161 | Good 5.2% |
| Immigrants | Egypt | 65.9 /100 | #162 | Good 5.2% |
| Immigrants | Hong Kong | 65.7 /100 | #163 | Good 5.2% |
| Afghans | 62.0 /100 | #164 | Good 5.3% |