Vietnamese vs Immigrants from Northern Africa Male Unemployment
COMPARE
Vietnamese
Immigrants from Northern Africa
Male Unemployment
Male Unemployment Comparison
Vietnamese
Immigrants from Northern Africa
6.6%
MALE UNEMPLOYMENT
0.0/ 100
METRIC RATING
300th/ 347
METRIC RANK
5.2%
MALE UNEMPLOYMENT
72.3/ 100
METRIC RATING
157th/ 347
METRIC RANK
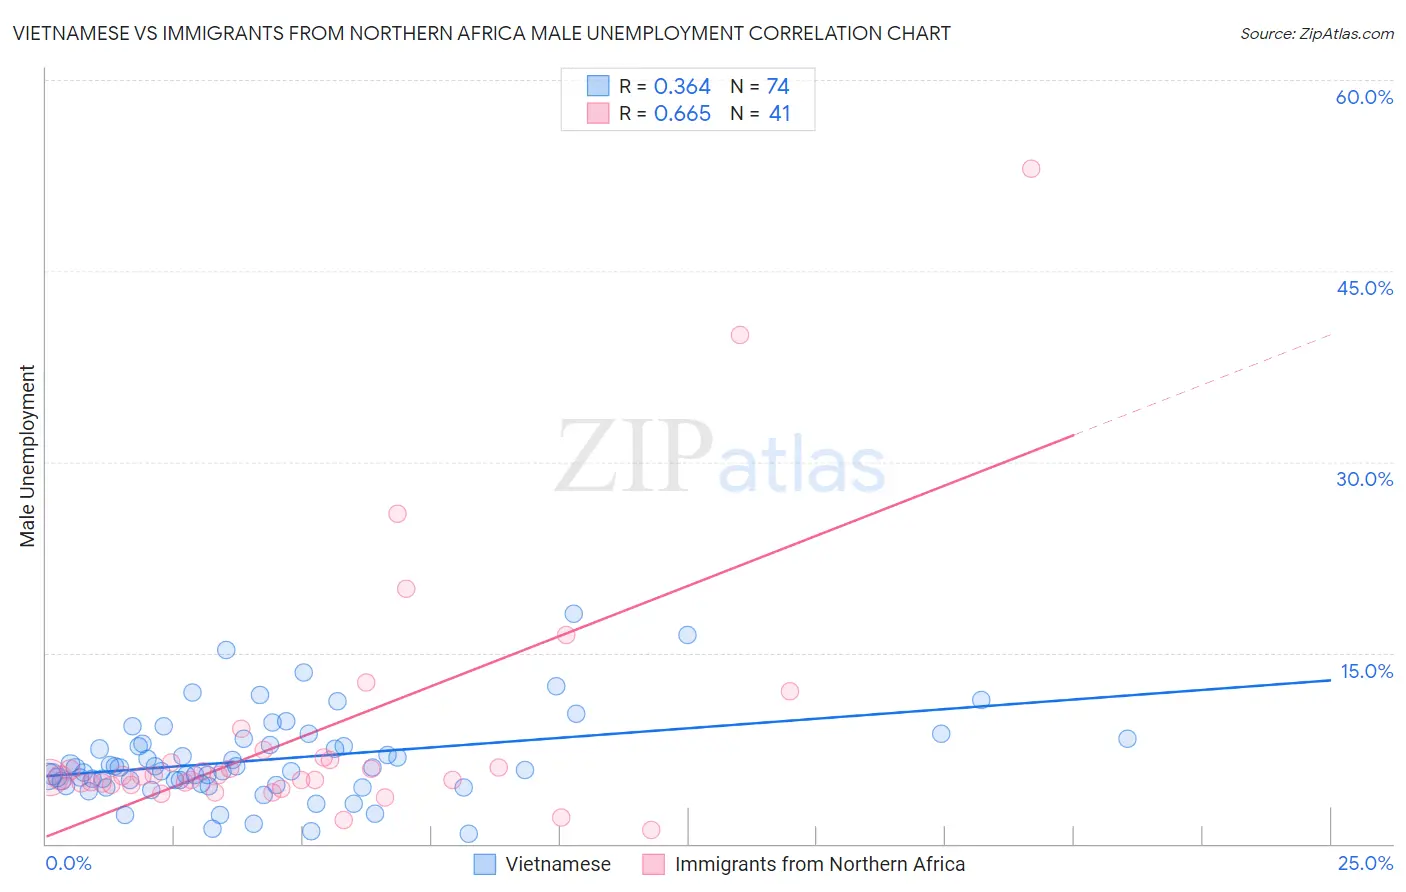
Vietnamese vs Immigrants from Northern Africa Male Unemployment Correlation Chart
The statistical analysis conducted on geographies consisting of 170,612,254 people shows a mild positive correlation between the proportion of Vietnamese and unemployment rate among males in the United States with a correlation coefficient (R) of 0.364 and weighted average of 6.6%. Similarly, the statistical analysis conducted on geographies consisting of 320,554,315 people shows a significant positive correlation between the proportion of Immigrants from Northern Africa and unemployment rate among males in the United States with a correlation coefficient (R) of 0.665 and weighted average of 5.2%, a difference of 26.1%.
Male Unemployment Correlation Summary
| Measurement | Vietnamese | Immigrants from Northern Africa |
| Minimum | 0.80% | 1.1% |
| Maximum | 18.1% | 53.0% |
| Range | 17.3% | 51.9% |
| Mean | 6.6% | 8.6% |
| Median | 5.9% | 5.3% |
| Interquartile 25% (IQ1) | 4.7% | 4.7% |
| Interquartile 75% (IQ3) | 7.8% | 6.7% |
| Interquartile Range (IQR) | 3.1% | 2.0% |
| Standard Deviation (Sample) | 3.4% | 10.0% |
| Standard Deviation (Population) | 3.3% | 9.9% |
Similar Demographics by Male Unemployment
Demographics Similar to Vietnamese by Male Unemployment
In terms of male unemployment, the demographic groups most similar to Vietnamese are Immigrants from Belize (6.6%, a difference of 0.11%), Immigrants from Bangladesh (6.6%, a difference of 0.27%), Jamaican (6.6%, a difference of 0.40%), Chippewa (6.6%, a difference of 0.48%), and Immigrants from Haiti (6.5%, a difference of 0.80%).
| Demographics | Rating | Rank | Male Unemployment |
| Haitians | 0.0 /100 | #293 | Tragic 6.4% |
| Senegalese | 0.0 /100 | #294 | Tragic 6.4% |
| Belizeans | 0.0 /100 | #295 | Tragic 6.5% |
| Immigrants | Haiti | 0.0 /100 | #296 | Tragic 6.5% |
| Chippewa | 0.0 /100 | #297 | Tragic 6.6% |
| Jamaicans | 0.0 /100 | #298 | Tragic 6.6% |
| Immigrants | Bangladesh | 0.0 /100 | #299 | Tragic 6.6% |
| Vietnamese | 0.0 /100 | #300 | Tragic 6.6% |
| Immigrants | Belize | 0.0 /100 | #301 | Tragic 6.6% |
| Ute | 0.0 /100 | #302 | Tragic 6.6% |
| Immigrants | West Indies | 0.0 /100 | #303 | Tragic 6.7% |
| West Indians | 0.0 /100 | #304 | Tragic 6.7% |
| Trinidadians and Tobagonians | 0.0 /100 | #305 | Tragic 6.7% |
| Immigrants | Trinidad and Tobago | 0.0 /100 | #306 | Tragic 6.7% |
| Immigrants | Jamaica | 0.0 /100 | #307 | Tragic 6.7% |
Demographics Similar to Immigrants from Northern Africa by Male Unemployment
In terms of male unemployment, the demographic groups most similar to Immigrants from Northern Africa are American (5.2%, a difference of 0.030%), Immigrants from Indonesia (5.2%, a difference of 0.050%), Immigrants from Hungary (5.2%, a difference of 0.080%), Indonesian (5.2%, a difference of 0.080%), and Immigrants from Norway (5.2%, a difference of 0.090%).
| Demographics | Rating | Rank | Male Unemployment |
| Indians (Asian) | 76.0 /100 | #150 | Good 5.2% |
| Slovaks | 75.5 /100 | #151 | Good 5.2% |
| Egyptians | 74.8 /100 | #152 | Good 5.2% |
| Immigrants | Uruguay | 73.9 /100 | #153 | Good 5.2% |
| Laotians | 73.8 /100 | #154 | Good 5.2% |
| Immigrants | Hungary | 73.4 /100 | #155 | Good 5.2% |
| Americans | 72.7 /100 | #156 | Good 5.2% |
| Immigrants | Northern Africa | 72.3 /100 | #157 | Good 5.2% |
| Immigrants | Indonesia | 71.5 /100 | #158 | Good 5.2% |
| Indonesians | 71.2 /100 | #159 | Good 5.2% |
| Immigrants | Norway | 71.0 /100 | #160 | Good 5.2% |
| Immigrants | China | 70.6 /100 | #161 | Good 5.2% |
| Immigrants | Egypt | 65.9 /100 | #162 | Good 5.2% |
| Immigrants | Hong Kong | 65.7 /100 | #163 | Good 5.2% |
| Afghans | 62.0 /100 | #164 | Good 5.3% |