Ghanaian vs Immigrants from Northern Africa 2 or more Vehicles in Household
COMPARE
Ghanaian
Immigrants from Northern Africa
2 or more Vehicles in Household
2 or more Vehicles in Household Comparison
Ghanaians
Immigrants from Northern Africa
48.0%
2 OR MORE VEHICLES IN HOUSEHOLD
0.0/ 100
METRIC RATING
310th/ 347
METRIC RANK
52.3%
2 OR MORE VEHICLES IN HOUSEHOLD
0.4/ 100
METRIC RATING
262nd/ 347
METRIC RANK
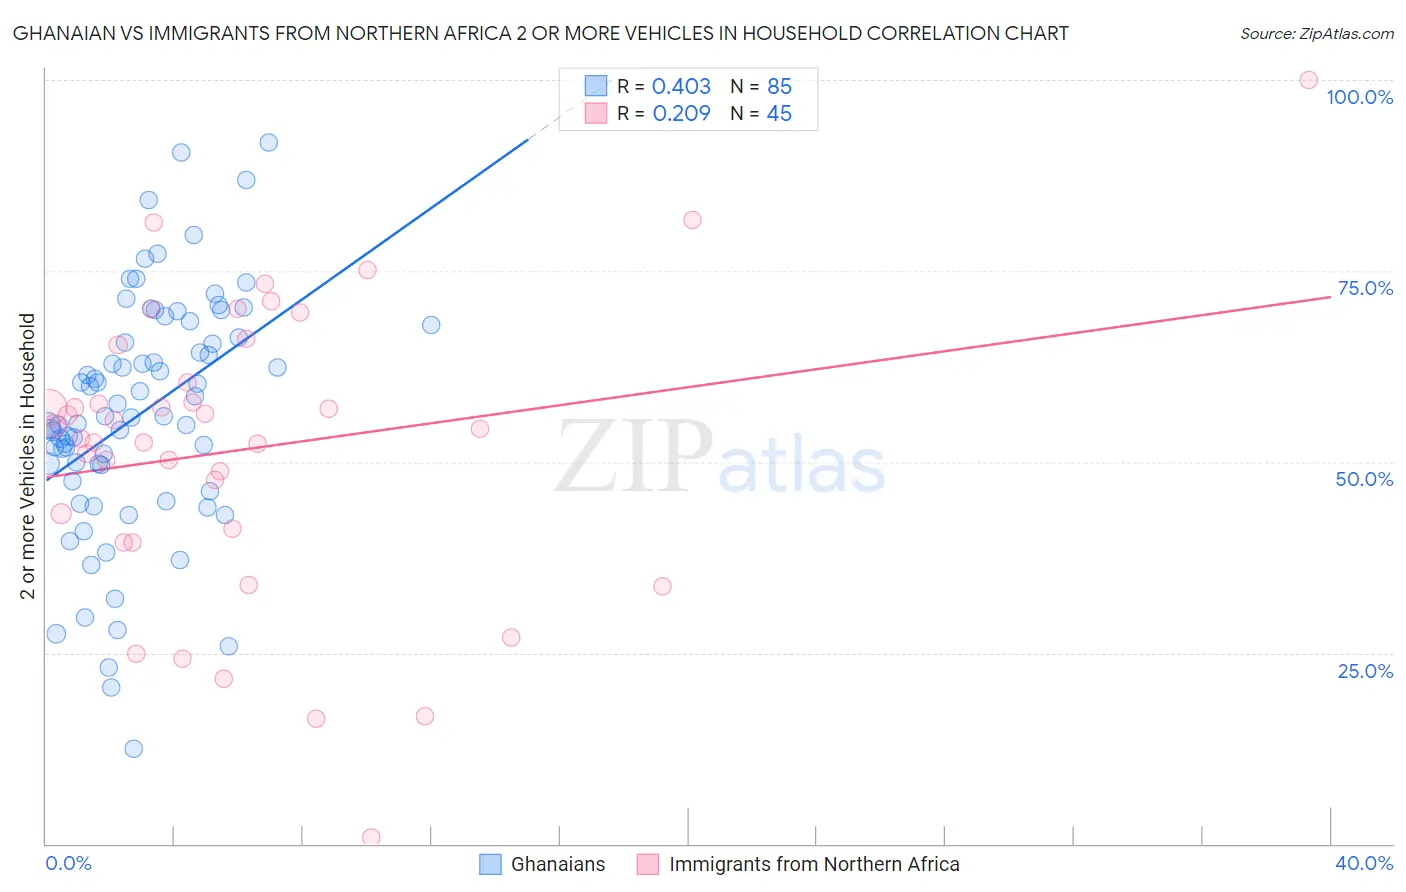
Ghanaian vs Immigrants from Northern Africa 2 or more Vehicles in Household Correlation Chart
The statistical analysis conducted on geographies consisting of 190,548,121 people shows a moderate positive correlation between the proportion of Ghanaians and percentage of households with 2 or more vehicles available in the United States with a correlation coefficient (R) of 0.403 and weighted average of 48.0%. Similarly, the statistical analysis conducted on geographies consisting of 321,098,836 people shows a weak positive correlation between the proportion of Immigrants from Northern Africa and percentage of households with 2 or more vehicles available in the United States with a correlation coefficient (R) of 0.209 and weighted average of 52.3%, a difference of 9.1%.
2 or more Vehicles in Household Correlation Summary
| Measurement | Ghanaian | Immigrants from Northern Africa |
| Minimum | 12.4% | 0.83% |
| Maximum | 91.9% | 100.0% |
| Range | 79.5% | 99.2% |
| Mean | 56.3% | 51.7% |
| Median | 55.9% | 54.3% |
| Interquartile 25% (IQ1) | 48.5% | 40.4% |
| Interquartile 75% (IQ3) | 67.2% | 62.8% |
| Interquartile Range (IQR) | 18.7% | 22.4% |
| Standard Deviation (Sample) | 15.6% | 19.3% |
| Standard Deviation (Population) | 15.5% | 19.1% |
Similar Demographics by 2 or more Vehicles in Household
Demographics Similar to Ghanaians by 2 or more Vehicles in Household
In terms of 2 or more vehicles in household, the demographic groups most similar to Ghanaians are Immigrants from Belarus (47.9%, a difference of 0.12%), Haitian (47.6%, a difference of 0.86%), U.S. Virgin Islander (47.5%, a difference of 1.0%), Immigrants from Ghana (47.4%, a difference of 1.3%), and Moroccan (48.8%, a difference of 1.8%).
| Demographics | Rating | Rank | 2 or more Vehicles in Household |
| Tohono O'odham | 0.0 /100 | #303 | Tragic 50.0% |
| Immigrants | Belize | 0.0 /100 | #304 | Tragic 49.9% |
| Immigrants | Western Africa | 0.0 /100 | #305 | Tragic 49.4% |
| Immigrants | Israel | 0.0 /100 | #306 | Tragic 49.2% |
| Hopi | 0.0 /100 | #307 | Tragic 49.0% |
| Albanians | 0.0 /100 | #308 | Tragic 49.0% |
| Moroccans | 0.0 /100 | #309 | Tragic 48.8% |
| Ghanaians | 0.0 /100 | #310 | Tragic 48.0% |
| Immigrants | Belarus | 0.0 /100 | #311 | Tragic 47.9% |
| Haitians | 0.0 /100 | #312 | Tragic 47.6% |
| U.S. Virgin Islanders | 0.0 /100 | #313 | Tragic 47.5% |
| Immigrants | Ghana | 0.0 /100 | #314 | Tragic 47.4% |
| Puerto Ricans | 0.0 /100 | #315 | Tragic 47.1% |
| Cape Verdeans | 0.0 /100 | #316 | Tragic 46.8% |
| Immigrants | Haiti | 0.0 /100 | #317 | Tragic 46.5% |
Demographics Similar to Immigrants from Northern Africa by 2 or more Vehicles in Household
In terms of 2 or more vehicles in household, the demographic groups most similar to Immigrants from Northern Africa are Immigrants from Southern Europe (52.3%, a difference of 0.13%), Immigrants from Latvia (52.2%, a difference of 0.17%), Immigrants from Australia (52.4%, a difference of 0.20%), Immigrants from Bahamas (52.5%, a difference of 0.23%), and Alsatian (52.5%, a difference of 0.30%).
| Demographics | Rating | Rank | 2 or more Vehicles in Household |
| Uruguayans | 0.7 /100 | #255 | Tragic 52.7% |
| Immigrants | Eritrea | 0.7 /100 | #256 | Tragic 52.6% |
| Immigrants | Hong Kong | 0.6 /100 | #257 | Tragic 52.6% |
| Central American Indians | 0.6 /100 | #258 | Tragic 52.5% |
| Alsatians | 0.6 /100 | #259 | Tragic 52.5% |
| Immigrants | Bahamas | 0.5 /100 | #260 | Tragic 52.5% |
| Immigrants | Australia | 0.5 /100 | #261 | Tragic 52.4% |
| Immigrants | Northern Africa | 0.4 /100 | #262 | Tragic 52.3% |
| Immigrants | Southern Europe | 0.4 /100 | #263 | Tragic 52.3% |
| Immigrants | Latvia | 0.4 /100 | #264 | Tragic 52.2% |
| Immigrants | Congo | 0.3 /100 | #265 | Tragic 52.1% |
| Immigrants | France | 0.2 /100 | #266 | Tragic 52.0% |
| Immigrants | Colombia | 0.2 /100 | #267 | Tragic 52.0% |
| Pima | 0.2 /100 | #268 | Tragic 52.0% |
| Hondurans | 0.2 /100 | #269 | Tragic 52.0% |