Arab vs Immigrants from Sudan Male Unemployment
COMPARE
Arab
Immigrants from Sudan
Male Unemployment
Male Unemployment Comparison
Arabs
Immigrants from Sudan
5.4%
MALE UNEMPLOYMENT
30.2/ 100
METRIC RATING
188th/ 347
METRIC RANK
5.0%
MALE UNEMPLOYMENT
96.5/ 100
METRIC RATING
76th/ 347
METRIC RANK
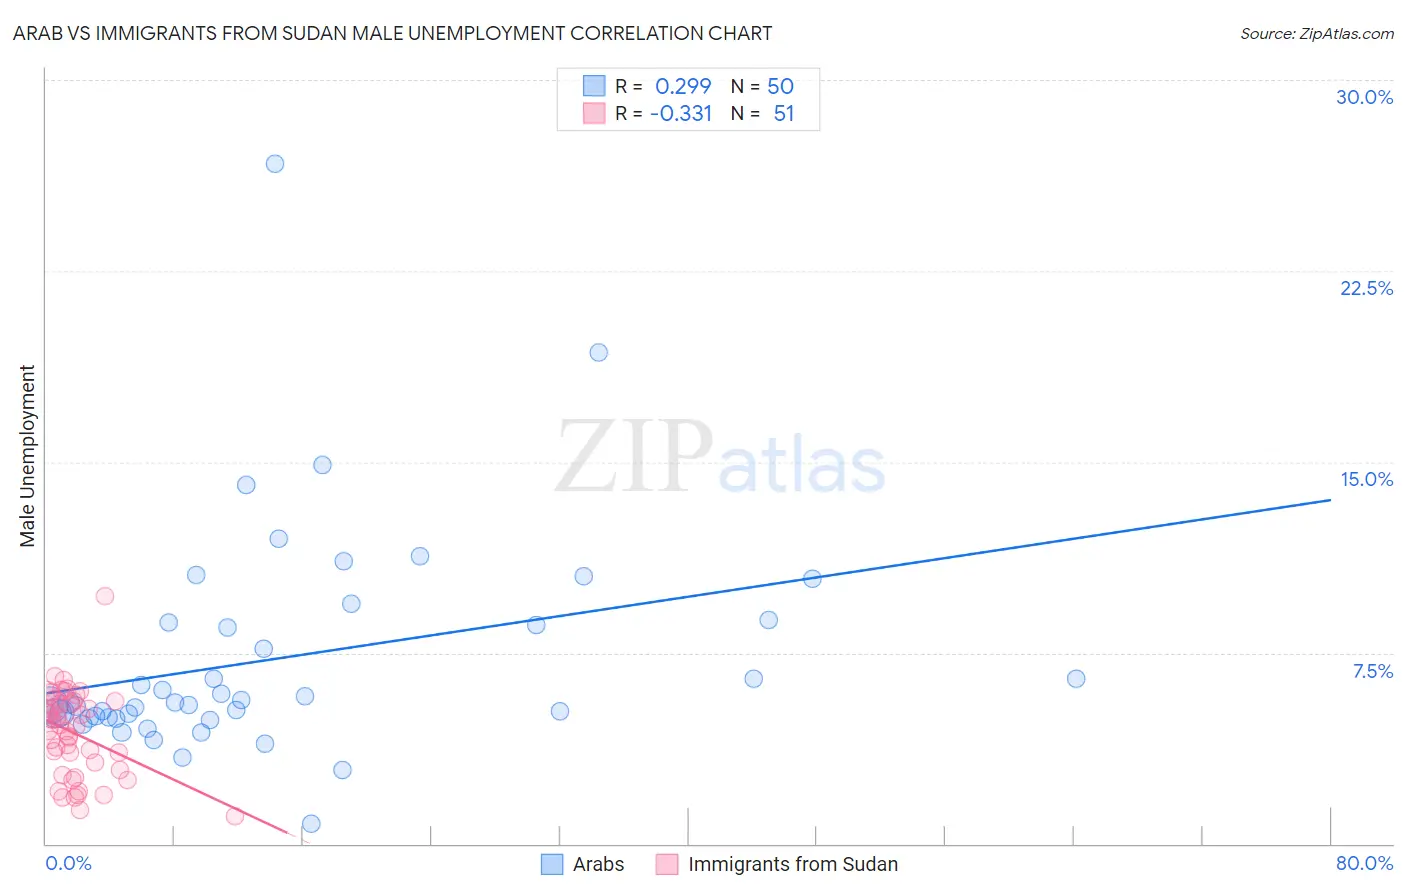
Arab vs Immigrants from Sudan Male Unemployment Correlation Chart
The statistical analysis conducted on geographies consisting of 483,718,645 people shows a weak positive correlation between the proportion of Arabs and unemployment rate among males in the United States with a correlation coefficient (R) of 0.299 and weighted average of 5.4%. Similarly, the statistical analysis conducted on geographies consisting of 118,895,845 people shows a mild negative correlation between the proportion of Immigrants from Sudan and unemployment rate among males in the United States with a correlation coefficient (R) of -0.331 and weighted average of 5.0%, a difference of 6.4%.
Male Unemployment Correlation Summary
| Measurement | Arab | Immigrants from Sudan |
| Minimum | 0.80% | 1.1% |
| Maximum | 26.7% | 9.7% |
| Range | 25.9% | 8.6% |
| Mean | 7.3% | 4.3% |
| Median | 5.5% | 4.6% |
| Interquartile 25% (IQ1) | 4.9% | 2.9% |
| Interquartile 75% (IQ3) | 8.7% | 5.6% |
| Interquartile Range (IQR) | 3.7% | 2.7% |
| Standard Deviation (Sample) | 4.4% | 1.7% |
| Standard Deviation (Population) | 4.3% | 1.7% |
Similar Demographics by Male Unemployment
Demographics Similar to Arabs by Male Unemployment
In terms of male unemployment, the demographic groups most similar to Arabs are Immigrants from South America (5.4%, a difference of 0.060%), Costa Rican (5.4%, a difference of 0.080%), Iraqi (5.4%, a difference of 0.090%), Immigrants from Uganda (5.4%, a difference of 0.10%), and Immigrants from South Eastern Asia (5.4%, a difference of 0.14%).
| Demographics | Rating | Rank | Male Unemployment |
| Immigrants | Afghanistan | 37.9 /100 | #181 | Fair 5.3% |
| Potawatomi | 37.8 /100 | #182 | Fair 5.3% |
| Taiwanese | 37.6 /100 | #183 | Fair 5.3% |
| Spaniards | 35.1 /100 | #184 | Fair 5.3% |
| Koreans | 34.9 /100 | #185 | Fair 5.3% |
| Iraqis | 31.6 /100 | #186 | Fair 5.4% |
| Costa Ricans | 31.3 /100 | #187 | Fair 5.4% |
| Arabs | 30.2 /100 | #188 | Fair 5.4% |
| Immigrants | South America | 29.4 /100 | #189 | Fair 5.4% |
| Immigrants | Uganda | 28.8 /100 | #190 | Fair 5.4% |
| Immigrants | South Eastern Asia | 28.2 /100 | #191 | Fair 5.4% |
| Immigrants | Belarus | 26.0 /100 | #192 | Fair 5.4% |
| Immigrants | Israel | 25.2 /100 | #193 | Fair 5.4% |
| Spanish | 19.7 /100 | #194 | Poor 5.4% |
| Immigrants | Southern Europe | 17.7 /100 | #195 | Poor 5.4% |
Demographics Similar to Immigrants from Sudan by Male Unemployment
In terms of male unemployment, the demographic groups most similar to Immigrants from Sudan are Iranian (5.0%, a difference of 0.050%), Immigrants from Northern Europe (5.0%, a difference of 0.060%), South African (5.0%, a difference of 0.070%), Argentinean (5.0%, a difference of 0.12%), and French (5.0%, a difference of 0.13%).
| Demographics | Rating | Rank | Male Unemployment |
| Immigrants | Sweden | 97.4 /100 | #69 | Exceptional 5.0% |
| Whites/Caucasians | 97.3 /100 | #70 | Exceptional 5.0% |
| New Zealanders | 97.3 /100 | #71 | Exceptional 5.0% |
| Immigrants | South Africa | 97.1 /100 | #72 | Exceptional 5.0% |
| Greeks | 97.0 /100 | #73 | Exceptional 5.0% |
| Immigrants | North America | 96.9 /100 | #74 | Exceptional 5.0% |
| Assyrians/Chaldeans/Syriacs | 96.9 /100 | #75 | Exceptional 5.0% |
| Immigrants | Sudan | 96.5 /100 | #76 | Exceptional 5.0% |
| Iranians | 96.4 /100 | #77 | Exceptional 5.0% |
| Immigrants | Northern Europe | 96.4 /100 | #78 | Exceptional 5.0% |
| South Africans | 96.4 /100 | #79 | Exceptional 5.0% |
| Argentineans | 96.2 /100 | #80 | Exceptional 5.0% |
| French | 96.2 /100 | #81 | Exceptional 5.0% |
| Chileans | 96.2 /100 | #82 | Exceptional 5.0% |
| Immigrants | Eritrea | 96.0 /100 | #83 | Exceptional 5.0% |