Yugoslavian vs Immigrants from Sudan Male Unemployment
COMPARE
Yugoslavian
Immigrants from Sudan
Male Unemployment
Male Unemployment Comparison
Yugoslavians
Immigrants from Sudan
5.0%
MALE UNEMPLOYMENT
98.7/ 100
METRIC RATING
54th/ 347
METRIC RANK
5.0%
MALE UNEMPLOYMENT
96.5/ 100
METRIC RATING
76th/ 347
METRIC RANK
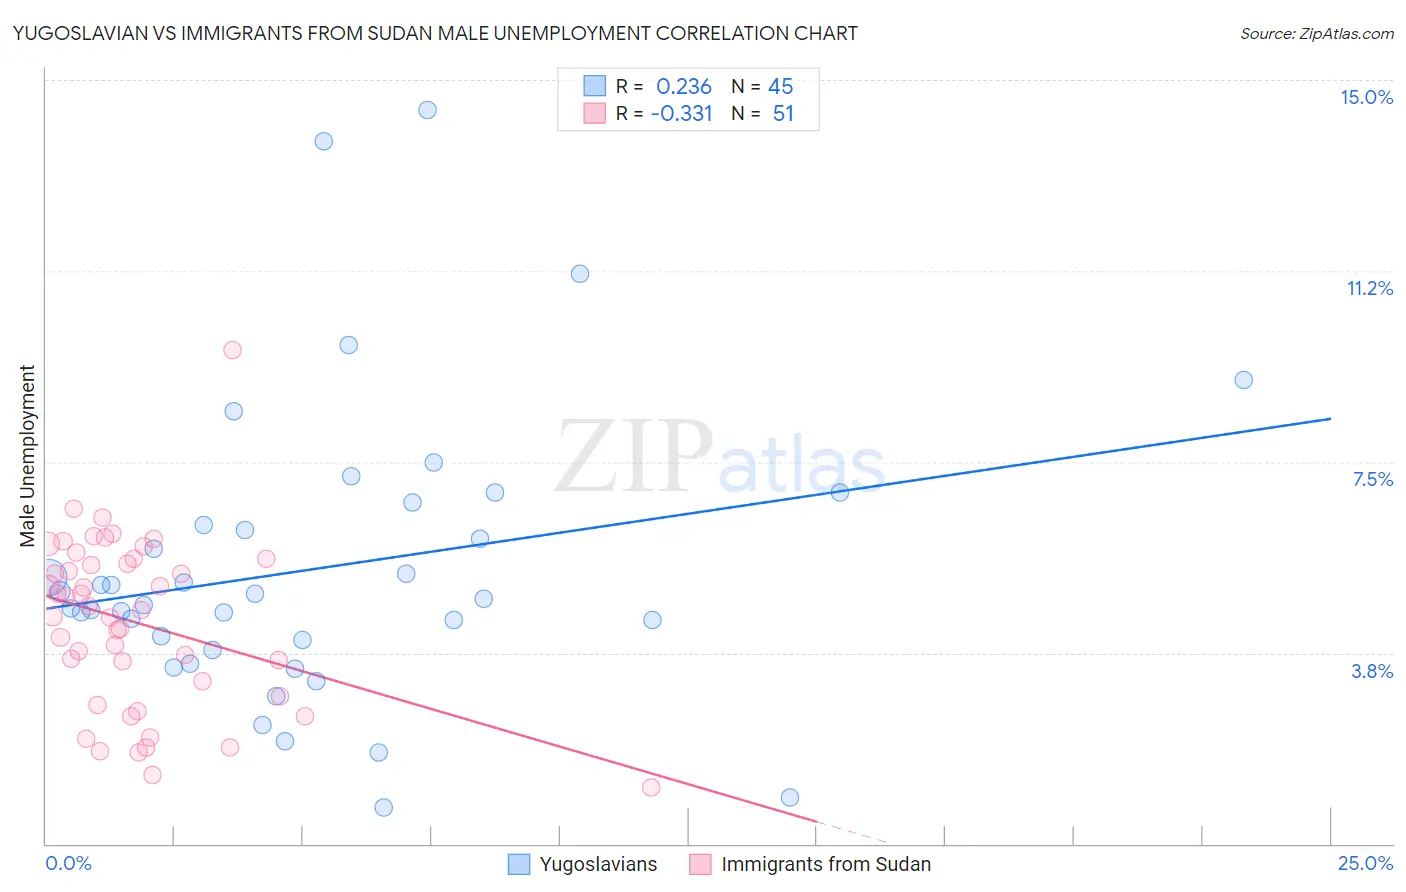
Yugoslavian vs Immigrants from Sudan Male Unemployment Correlation Chart
The statistical analysis conducted on geographies consisting of 284,881,859 people shows a weak positive correlation between the proportion of Yugoslavians and unemployment rate among males in the United States with a correlation coefficient (R) of 0.236 and weighted average of 5.0%. Similarly, the statistical analysis conducted on geographies consisting of 118,895,845 people shows a mild negative correlation between the proportion of Immigrants from Sudan and unemployment rate among males in the United States with a correlation coefficient (R) of -0.331 and weighted average of 5.0%, a difference of 1.6%.
Male Unemployment Correlation Summary
| Measurement | Yugoslavian | Immigrants from Sudan |
| Minimum | 0.70% | 1.1% |
| Maximum | 14.4% | 9.7% |
| Range | 13.7% | 8.6% |
| Mean | 5.4% | 4.3% |
| Median | 4.8% | 4.6% |
| Interquartile 25% (IQ1) | 3.9% | 2.9% |
| Interquartile 75% (IQ3) | 6.5% | 5.6% |
| Interquartile Range (IQR) | 2.6% | 2.7% |
| Standard Deviation (Sample) | 2.8% | 1.7% |
| Standard Deviation (Population) | 2.8% | 1.7% |
Similar Demographics by Male Unemployment
Demographics Similar to Yugoslavians by Male Unemployment
In terms of male unemployment, the demographic groups most similar to Yugoslavians are Czechoslovakian (5.0%, a difference of 0.0%), Immigrants from Bulgaria (5.0%, a difference of 0.010%), Jordanian (5.0%, a difference of 0.10%), Irish (5.0%, a difference of 0.16%), and Slovene (5.0%, a difference of 0.18%).
| Demographics | Rating | Rank | Male Unemployment |
| Austrians | 98.9 /100 | #47 | Exceptional 4.9% |
| Immigrants | Scotland | 98.9 /100 | #48 | Exceptional 4.9% |
| Poles | 98.9 /100 | #49 | Exceptional 4.9% |
| Croatians | 98.9 /100 | #50 | Exceptional 4.9% |
| Slovenes | 98.8 /100 | #51 | Exceptional 5.0% |
| Irish | 98.8 /100 | #52 | Exceptional 5.0% |
| Jordanians | 98.8 /100 | #53 | Exceptional 5.0% |
| Yugoslavians | 98.7 /100 | #54 | Exceptional 5.0% |
| Czechoslovakians | 98.7 /100 | #55 | Exceptional 5.0% |
| Immigrants | Bulgaria | 98.7 /100 | #56 | Exceptional 5.0% |
| Turks | 98.5 /100 | #57 | Exceptional 5.0% |
| Lithuanians | 98.5 /100 | #58 | Exceptional 5.0% |
| Immigrants | Netherlands | 98.3 /100 | #59 | Exceptional 5.0% |
| Immigrants | Argentina | 98.1 /100 | #60 | Exceptional 5.0% |
| Cambodians | 98.1 /100 | #61 | Exceptional 5.0% |
Demographics Similar to Immigrants from Sudan by Male Unemployment
In terms of male unemployment, the demographic groups most similar to Immigrants from Sudan are Iranian (5.0%, a difference of 0.050%), Immigrants from Northern Europe (5.0%, a difference of 0.060%), South African (5.0%, a difference of 0.070%), Argentinean (5.0%, a difference of 0.12%), and French (5.0%, a difference of 0.13%).
| Demographics | Rating | Rank | Male Unemployment |
| Immigrants | Sweden | 97.4 /100 | #69 | Exceptional 5.0% |
| Whites/Caucasians | 97.3 /100 | #70 | Exceptional 5.0% |
| New Zealanders | 97.3 /100 | #71 | Exceptional 5.0% |
| Immigrants | South Africa | 97.1 /100 | #72 | Exceptional 5.0% |
| Greeks | 97.0 /100 | #73 | Exceptional 5.0% |
| Immigrants | North America | 96.9 /100 | #74 | Exceptional 5.0% |
| Assyrians/Chaldeans/Syriacs | 96.9 /100 | #75 | Exceptional 5.0% |
| Immigrants | Sudan | 96.5 /100 | #76 | Exceptional 5.0% |
| Iranians | 96.4 /100 | #77 | Exceptional 5.0% |
| Immigrants | Northern Europe | 96.4 /100 | #78 | Exceptional 5.0% |
| South Africans | 96.4 /100 | #79 | Exceptional 5.0% |
| Argentineans | 96.2 /100 | #80 | Exceptional 5.0% |
| French | 96.2 /100 | #81 | Exceptional 5.0% |
| Chileans | 96.2 /100 | #82 | Exceptional 5.0% |
| Immigrants | Eritrea | 96.0 /100 | #83 | Exceptional 5.0% |