Cree vs Immigrants from Sudan Male Unemployment
COMPARE
Cree
Immigrants from Sudan
Male Unemployment
Male Unemployment Comparison
Cree
Immigrants from Sudan
5.7%
MALE UNEMPLOYMENT
0.4/ 100
METRIC RATING
249th/ 347
METRIC RANK
5.0%
MALE UNEMPLOYMENT
96.5/ 100
METRIC RATING
76th/ 347
METRIC RANK
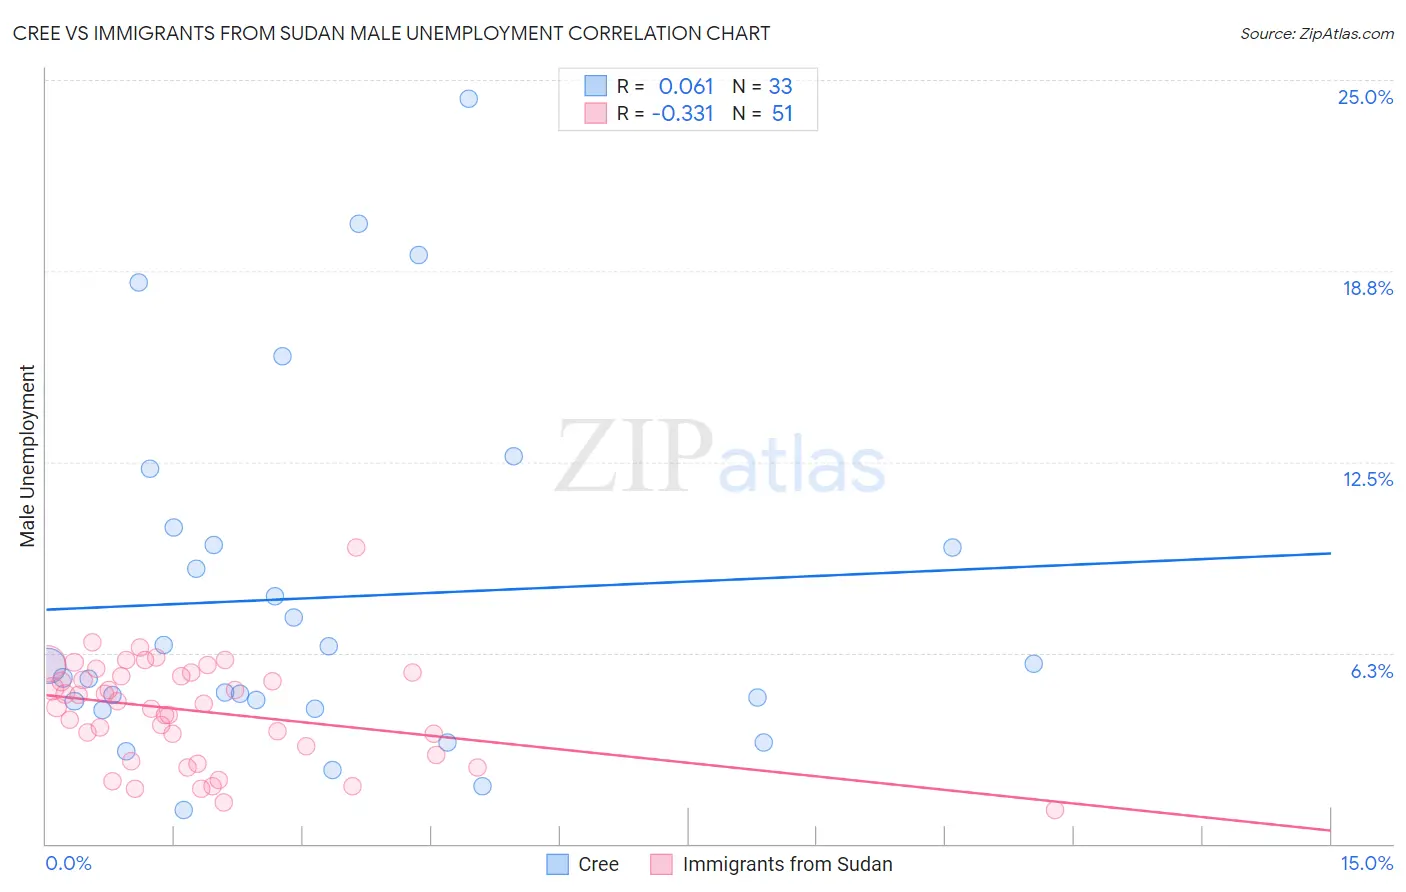
Cree vs Immigrants from Sudan Male Unemployment Correlation Chart
The statistical analysis conducted on geographies consisting of 76,096,114 people shows a slight positive correlation between the proportion of Cree and unemployment rate among males in the United States with a correlation coefficient (R) of 0.061 and weighted average of 5.7%. Similarly, the statistical analysis conducted on geographies consisting of 118,895,845 people shows a mild negative correlation between the proportion of Immigrants from Sudan and unemployment rate among males in the United States with a correlation coefficient (R) of -0.331 and weighted average of 5.0%, a difference of 13.5%.
Male Unemployment Correlation Summary
| Measurement | Cree | Immigrants from Sudan |
| Minimum | 1.1% | 1.1% |
| Maximum | 24.4% | 9.7% |
| Range | 23.3% | 8.6% |
| Mean | 8.1% | 4.3% |
| Median | 5.8% | 4.6% |
| Interquartile 25% (IQ1) | 4.5% | 2.9% |
| Interquartile 75% (IQ3) | 10.1% | 5.6% |
| Interquartile Range (IQR) | 5.5% | 2.7% |
| Standard Deviation (Sample) | 5.8% | 1.7% |
| Standard Deviation (Population) | 5.7% | 1.7% |
Similar Demographics by Male Unemployment
Demographics Similar to Cree by Male Unemployment
In terms of male unemployment, the demographic groups most similar to Cree are Marshallese (5.7%, a difference of 0.070%), Immigrants from Bahamas (5.7%, a difference of 0.24%), Spanish American (5.7%, a difference of 0.29%), Hawaiian (5.7%, a difference of 0.39%), and Iroquois (5.7%, a difference of 0.48%).
| Demographics | Rating | Rank | Male Unemployment |
| Ottawa | 0.9 /100 | #242 | Tragic 5.7% |
| Bangladeshis | 0.8 /100 | #243 | Tragic 5.7% |
| Immigrants | El Salvador | 0.7 /100 | #244 | Tragic 5.7% |
| Yaqui | 0.7 /100 | #245 | Tragic 5.7% |
| Iroquois | 0.6 /100 | #246 | Tragic 5.7% |
| Hawaiians | 0.6 /100 | #247 | Tragic 5.7% |
| Marshallese | 0.5 /100 | #248 | Tragic 5.7% |
| Cree | 0.4 /100 | #249 | Tragic 5.7% |
| Immigrants | Bahamas | 0.4 /100 | #250 | Tragic 5.7% |
| Spanish Americans | 0.3 /100 | #251 | Tragic 5.7% |
| Mexicans | 0.2 /100 | #252 | Tragic 5.8% |
| Mexican American Indians | 0.2 /100 | #253 | Tragic 5.8% |
| Japanese | 0.2 /100 | #254 | Tragic 5.8% |
| Kiowa | 0.2 /100 | #255 | Tragic 5.8% |
| Comanche | 0.2 /100 | #256 | Tragic 5.8% |
Demographics Similar to Immigrants from Sudan by Male Unemployment
In terms of male unemployment, the demographic groups most similar to Immigrants from Sudan are Iranian (5.0%, a difference of 0.050%), Immigrants from Northern Europe (5.0%, a difference of 0.060%), South African (5.0%, a difference of 0.070%), Argentinean (5.0%, a difference of 0.12%), and French (5.0%, a difference of 0.13%).
| Demographics | Rating | Rank | Male Unemployment |
| Immigrants | Sweden | 97.4 /100 | #69 | Exceptional 5.0% |
| Whites/Caucasians | 97.3 /100 | #70 | Exceptional 5.0% |
| New Zealanders | 97.3 /100 | #71 | Exceptional 5.0% |
| Immigrants | South Africa | 97.1 /100 | #72 | Exceptional 5.0% |
| Greeks | 97.0 /100 | #73 | Exceptional 5.0% |
| Immigrants | North America | 96.9 /100 | #74 | Exceptional 5.0% |
| Assyrians/Chaldeans/Syriacs | 96.9 /100 | #75 | Exceptional 5.0% |
| Immigrants | Sudan | 96.5 /100 | #76 | Exceptional 5.0% |
| Iranians | 96.4 /100 | #77 | Exceptional 5.0% |
| Immigrants | Northern Europe | 96.4 /100 | #78 | Exceptional 5.0% |
| South Africans | 96.4 /100 | #79 | Exceptional 5.0% |
| Argentineans | 96.2 /100 | #80 | Exceptional 5.0% |
| French | 96.2 /100 | #81 | Exceptional 5.0% |
| Chileans | 96.2 /100 | #82 | Exceptional 5.0% |
| Immigrants | Eritrea | 96.0 /100 | #83 | Exceptional 5.0% |