Dominican vs Immigrants from Sudan Male Unemployment
COMPARE
Dominican
Immigrants from Sudan
Male Unemployment
Male Unemployment Comparison
Dominicans
Immigrants from Sudan
7.6%
MALE UNEMPLOYMENT
0.0/ 100
METRIC RATING
324th/ 347
METRIC RANK
5.0%
MALE UNEMPLOYMENT
96.5/ 100
METRIC RATING
76th/ 347
METRIC RANK
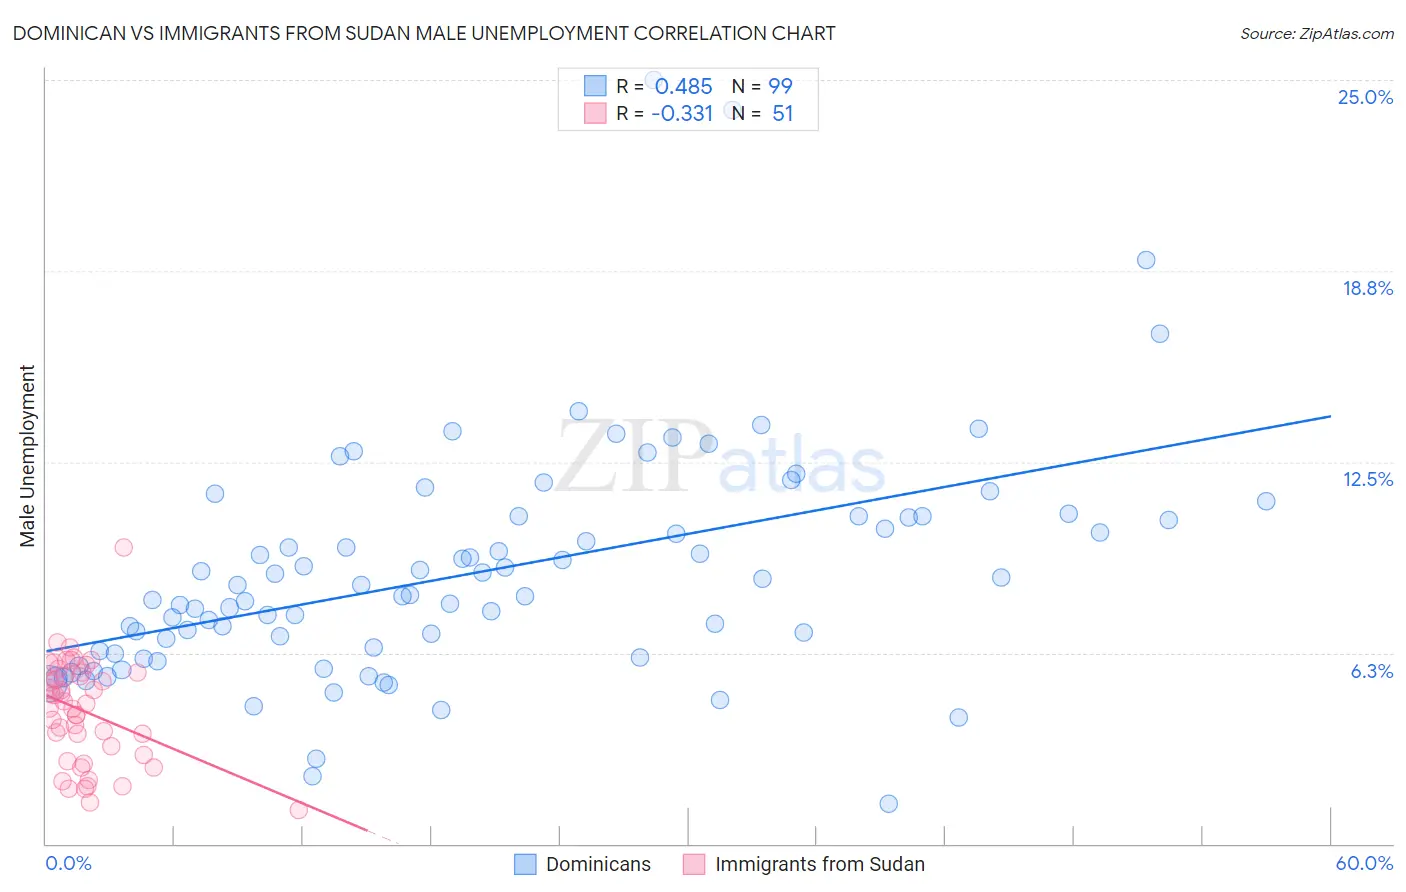
Dominican vs Immigrants from Sudan Male Unemployment Correlation Chart
The statistical analysis conducted on geographies consisting of 353,678,027 people shows a moderate positive correlation between the proportion of Dominicans and unemployment rate among males in the United States with a correlation coefficient (R) of 0.485 and weighted average of 7.6%. Similarly, the statistical analysis conducted on geographies consisting of 118,895,845 people shows a mild negative correlation between the proportion of Immigrants from Sudan and unemployment rate among males in the United States with a correlation coefficient (R) of -0.331 and weighted average of 5.0%, a difference of 50.3%.
Male Unemployment Correlation Summary
| Measurement | Dominican | Immigrants from Sudan |
| Minimum | 1.3% | 1.1% |
| Maximum | 25.0% | 9.7% |
| Range | 23.7% | 8.6% |
| Mean | 8.9% | 4.3% |
| Median | 8.1% | 4.6% |
| Interquartile 25% (IQ1) | 6.2% | 2.9% |
| Interquartile 75% (IQ3) | 10.7% | 5.6% |
| Interquartile Range (IQR) | 4.5% | 2.7% |
| Standard Deviation (Sample) | 3.8% | 1.7% |
| Standard Deviation (Population) | 3.8% | 1.7% |
Similar Demographics by Male Unemployment
Demographics Similar to Dominicans by Male Unemployment
In terms of male unemployment, the demographic groups most similar to Dominicans are Immigrants from Grenada (7.6%, a difference of 0.27%), Shoshone (7.6%, a difference of 0.37%), Immigrants from Dominican Republic (7.6%, a difference of 0.48%), Immigrants from Cabo Verde (7.5%, a difference of 1.1%), and Immigrants from St. Vincent and the Grenadines (7.5%, a difference of 1.4%).
| Demographics | Rating | Rank | Male Unemployment |
| Guyanese | 0.0 /100 | #317 | Tragic 7.1% |
| Cape Verdeans | 0.0 /100 | #318 | Tragic 7.1% |
| British West Indians | 0.0 /100 | #319 | Tragic 7.3% |
| Colville | 0.0 /100 | #320 | Tragic 7.4% |
| Immigrants | St. Vincent and the Grenadines | 0.0 /100 | #321 | Tragic 7.5% |
| Immigrants | Cabo Verde | 0.0 /100 | #322 | Tragic 7.5% |
| Immigrants | Grenada | 0.0 /100 | #323 | Tragic 7.6% |
| Dominicans | 0.0 /100 | #324 | Tragic 7.6% |
| Shoshone | 0.0 /100 | #325 | Tragic 7.6% |
| Immigrants | Dominican Republic | 0.0 /100 | #326 | Tragic 7.6% |
| Paiute | 0.0 /100 | #327 | Tragic 7.7% |
| Natives/Alaskans | 0.0 /100 | #328 | Tragic 7.7% |
| Immigrants | Yemen | 0.0 /100 | #329 | Tragic 7.8% |
| Yakama | 0.0 /100 | #330 | Tragic 7.9% |
| Alaska Natives | 0.0 /100 | #331 | Tragic 8.1% |
Demographics Similar to Immigrants from Sudan by Male Unemployment
In terms of male unemployment, the demographic groups most similar to Immigrants from Sudan are Iranian (5.0%, a difference of 0.050%), Immigrants from Northern Europe (5.0%, a difference of 0.060%), South African (5.0%, a difference of 0.070%), Argentinean (5.0%, a difference of 0.12%), and French (5.0%, a difference of 0.13%).
| Demographics | Rating | Rank | Male Unemployment |
| Immigrants | Sweden | 97.4 /100 | #69 | Exceptional 5.0% |
| Whites/Caucasians | 97.3 /100 | #70 | Exceptional 5.0% |
| New Zealanders | 97.3 /100 | #71 | Exceptional 5.0% |
| Immigrants | South Africa | 97.1 /100 | #72 | Exceptional 5.0% |
| Greeks | 97.0 /100 | #73 | Exceptional 5.0% |
| Immigrants | North America | 96.9 /100 | #74 | Exceptional 5.0% |
| Assyrians/Chaldeans/Syriacs | 96.9 /100 | #75 | Exceptional 5.0% |
| Immigrants | Sudan | 96.5 /100 | #76 | Exceptional 5.0% |
| Iranians | 96.4 /100 | #77 | Exceptional 5.0% |
| Immigrants | Northern Europe | 96.4 /100 | #78 | Exceptional 5.0% |
| South Africans | 96.4 /100 | #79 | Exceptional 5.0% |
| Argentineans | 96.2 /100 | #80 | Exceptional 5.0% |
| French | 96.2 /100 | #81 | Exceptional 5.0% |
| Chileans | 96.2 /100 | #82 | Exceptional 5.0% |
| Immigrants | Eritrea | 96.0 /100 | #83 | Exceptional 5.0% |