Ethiopian vs Ottawa Male Unemployment
COMPARE
Ethiopian
Ottawa
Male Unemployment
Male Unemployment Comparison
Ethiopians
Ottawa
5.1%
MALE UNEMPLOYMENT
91.3/ 100
METRIC RATING
107th/ 347
METRIC RANK
5.7%
MALE UNEMPLOYMENT
0.9/ 100
METRIC RATING
242nd/ 347
METRIC RANK
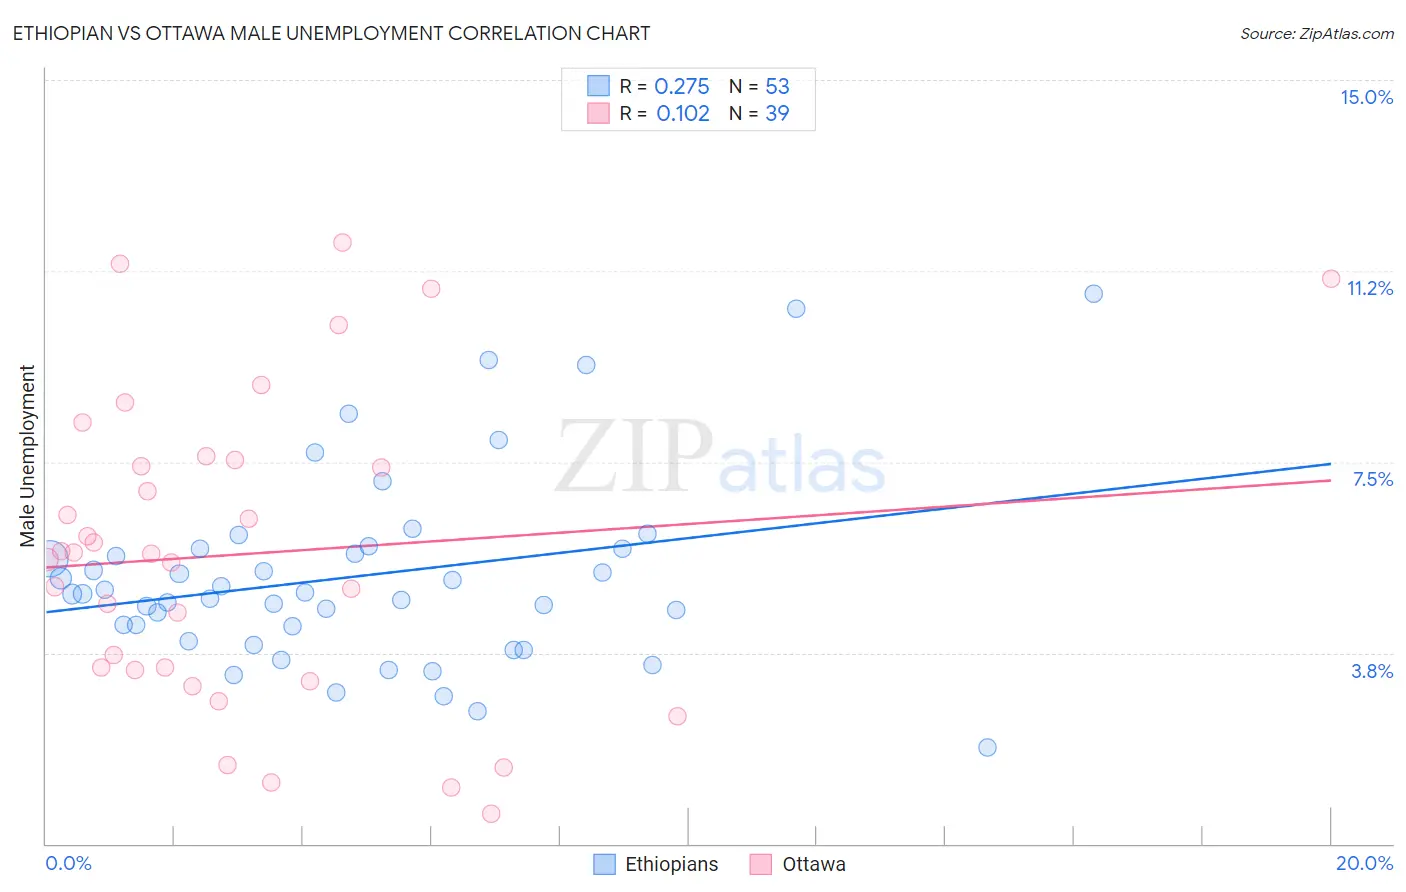
Ethiopian vs Ottawa Male Unemployment Correlation Chart
The statistical analysis conducted on geographies consisting of 222,844,986 people shows a weak positive correlation between the proportion of Ethiopians and unemployment rate among males in the United States with a correlation coefficient (R) of 0.275 and weighted average of 5.1%. Similarly, the statistical analysis conducted on geographies consisting of 49,911,932 people shows a poor positive correlation between the proportion of Ottawa and unemployment rate among males in the United States with a correlation coefficient (R) of 0.102 and weighted average of 5.7%, a difference of 10.6%.
Male Unemployment Correlation Summary
| Measurement | Ethiopian | Ottawa |
| Minimum | 1.9% | 0.60% |
| Maximum | 10.8% | 11.8% |
| Range | 8.9% | 11.2% |
| Mean | 5.3% | 5.7% |
| Median | 4.9% | 5.7% |
| Interquartile 25% (IQ1) | 4.1% | 3.4% |
| Interquartile 75% (IQ3) | 5.8% | 7.5% |
| Interquartile Range (IQR) | 1.7% | 4.1% |
| Standard Deviation (Sample) | 1.9% | 3.0% |
| Standard Deviation (Population) | 1.9% | 3.0% |
Similar Demographics by Male Unemployment
Demographics Similar to Ethiopians by Male Unemployment
In terms of male unemployment, the demographic groups most similar to Ethiopians are Immigrants from Nicaragua (5.1%, a difference of 0.010%), Immigrants from Ethiopia (5.1%, a difference of 0.040%), Immigrants from Pakistan (5.1%, a difference of 0.070%), Immigrants from Czechoslovakia (5.1%, a difference of 0.080%), and Immigrants from Chile (5.1%, a difference of 0.090%).
| Demographics | Rating | Rank | Male Unemployment |
| Russians | 92.9 /100 | #100 | Exceptional 5.1% |
| German Russians | 92.7 /100 | #101 | Exceptional 5.1% |
| Immigrants | France | 92.7 /100 | #102 | Exceptional 5.1% |
| Immigrants | Jordan | 91.9 /100 | #103 | Exceptional 5.1% |
| Immigrants | Chile | 91.8 /100 | #104 | Exceptional 5.1% |
| Immigrants | Czechoslovakia | 91.7 /100 | #105 | Exceptional 5.1% |
| Immigrants | Ethiopia | 91.5 /100 | #106 | Exceptional 5.1% |
| Ethiopians | 91.3 /100 | #107 | Exceptional 5.1% |
| Immigrants | Nicaragua | 91.2 /100 | #108 | Exceptional 5.1% |
| Immigrants | Pakistan | 90.9 /100 | #109 | Exceptional 5.1% |
| Immigrants | England | 90.8 /100 | #110 | Exceptional 5.1% |
| Immigrants | Eastern Asia | 90.8 /100 | #111 | Exceptional 5.1% |
| Immigrants | Moldova | 90.3 /100 | #112 | Exceptional 5.1% |
| Immigrants | Austria | 90.3 /100 | #113 | Exceptional 5.1% |
| Romanians | 89.8 /100 | #114 | Excellent 5.1% |
Demographics Similar to Ottawa by Male Unemployment
In terms of male unemployment, the demographic groups most similar to Ottawa are Salvadoran (5.7%, a difference of 0.070%), Immigrants from Cameroon (5.6%, a difference of 0.11%), Immigrants from Guatemala (5.6%, a difference of 0.18%), Native Hawaiian (5.6%, a difference of 0.19%), and Honduran (5.6%, a difference of 0.23%).
| Demographics | Rating | Rank | Male Unemployment |
| Immigrants | Honduras | 1.5 /100 | #235 | Tragic 5.6% |
| Guatemalans | 1.2 /100 | #236 | Tragic 5.6% |
| Hondurans | 1.1 /100 | #237 | Tragic 5.6% |
| Native Hawaiians | 1.1 /100 | #238 | Tragic 5.6% |
| Immigrants | Guatemala | 1.1 /100 | #239 | Tragic 5.6% |
| Immigrants | Cameroon | 1.0 /100 | #240 | Tragic 5.6% |
| Salvadorans | 1.0 /100 | #241 | Tragic 5.7% |
| Ottawa | 0.9 /100 | #242 | Tragic 5.7% |
| Bangladeshis | 0.8 /100 | #243 | Tragic 5.7% |
| Immigrants | El Salvador | 0.7 /100 | #244 | Tragic 5.7% |
| Yaqui | 0.7 /100 | #245 | Tragic 5.7% |
| Iroquois | 0.6 /100 | #246 | Tragic 5.7% |
| Hawaiians | 0.6 /100 | #247 | Tragic 5.7% |
| Marshallese | 0.5 /100 | #248 | Tragic 5.7% |
| Cree | 0.4 /100 | #249 | Tragic 5.7% |