Immigrants from Netherlands vs Immigrants from Sudan Male Unemployment
COMPARE
Immigrants from Netherlands
Immigrants from Sudan
Male Unemployment
Male Unemployment Comparison
Immigrants from Netherlands
Immigrants from Sudan
5.0%
MALE UNEMPLOYMENT
98.3/ 100
METRIC RATING
59th/ 347
METRIC RANK
5.0%
MALE UNEMPLOYMENT
96.5/ 100
METRIC RATING
76th/ 347
METRIC RANK
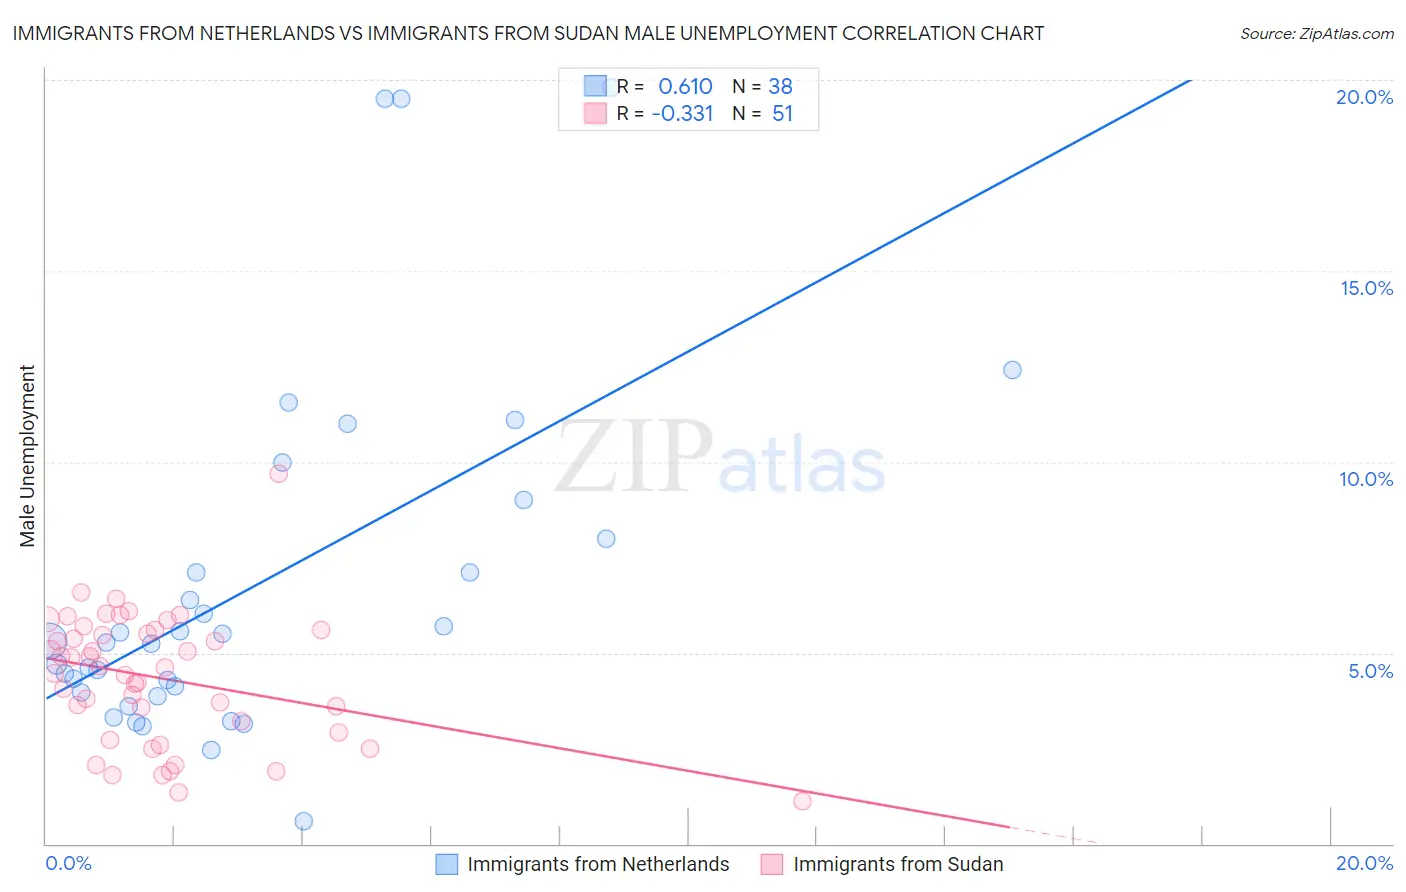
Immigrants from Netherlands vs Immigrants from Sudan Male Unemployment Correlation Chart
The statistical analysis conducted on geographies consisting of 237,368,894 people shows a significant positive correlation between the proportion of Immigrants from Netherlands and unemployment rate among males in the United States with a correlation coefficient (R) of 0.610 and weighted average of 5.0%. Similarly, the statistical analysis conducted on geographies consisting of 118,895,845 people shows a mild negative correlation between the proportion of Immigrants from Sudan and unemployment rate among males in the United States with a correlation coefficient (R) of -0.331 and weighted average of 5.0%, a difference of 1.2%.
Male Unemployment Correlation Summary
| Measurement | Immigrants from Netherlands | Immigrants from Sudan |
| Minimum | 0.60% | 1.1% |
| Maximum | 19.8% | 9.7% |
| Range | 19.2% | 8.6% |
| Mean | 6.8% | 4.3% |
| Median | 5.3% | 4.6% |
| Interquartile 25% (IQ1) | 4.0% | 2.9% |
| Interquartile 75% (IQ3) | 8.0% | 5.6% |
| Interquartile Range (IQR) | 4.0% | 2.7% |
| Standard Deviation (Sample) | 4.7% | 1.7% |
| Standard Deviation (Population) | 4.6% | 1.7% |
Demographics Similar to Immigrants from Netherlands and Immigrants from Sudan by Male Unemployment
In terms of male unemployment, the demographic groups most similar to Immigrants from Netherlands are Turkish (5.0%, a difference of 0.14%), Lithuanian (5.0%, a difference of 0.14%), Immigrants from Argentina (5.0%, a difference of 0.18%), Cambodian (5.0%, a difference of 0.26%), and Basque (5.0%, a difference of 0.39%). Similarly, the demographic groups most similar to Immigrants from Sudan are Iranian (5.0%, a difference of 0.050%), Assyrian/Chaldean/Syriac (5.0%, a difference of 0.16%), Immigrants from North America (5.0%, a difference of 0.19%), Greek (5.0%, a difference of 0.22%), and Immigrants from South Africa (5.0%, a difference of 0.30%).
| Demographics | Rating | Rank | Male Unemployment |
| Turks | 98.5 /100 | #57 | Exceptional 5.0% |
| Lithuanians | 98.5 /100 | #58 | Exceptional 5.0% |
| Immigrants | Netherlands | 98.3 /100 | #59 | Exceptional 5.0% |
| Immigrants | Argentina | 98.1 /100 | #60 | Exceptional 5.0% |
| Cambodians | 98.1 /100 | #61 | Exceptional 5.0% |
| Basques | 97.9 /100 | #62 | Exceptional 5.0% |
| Eastern Europeans | 97.9 /100 | #63 | Exceptional 5.0% |
| Celtics | 97.8 /100 | #64 | Exceptional 5.0% |
| Icelanders | 97.6 /100 | #65 | Exceptional 5.0% |
| Finns | 97.5 /100 | #66 | Exceptional 5.0% |
| Immigrants | Canada | 97.5 /100 | #67 | Exceptional 5.0% |
| Australians | 97.4 /100 | #68 | Exceptional 5.0% |
| Immigrants | Sweden | 97.4 /100 | #69 | Exceptional 5.0% |
| Whites/Caucasians | 97.3 /100 | #70 | Exceptional 5.0% |
| New Zealanders | 97.3 /100 | #71 | Exceptional 5.0% |
| Immigrants | South Africa | 97.1 /100 | #72 | Exceptional 5.0% |
| Greeks | 97.0 /100 | #73 | Exceptional 5.0% |
| Immigrants | North America | 96.9 /100 | #74 | Exceptional 5.0% |
| Assyrians/Chaldeans/Syriacs | 96.9 /100 | #75 | Exceptional 5.0% |
| Immigrants | Sudan | 96.5 /100 | #76 | Exceptional 5.0% |
| Iranians | 96.4 /100 | #77 | Exceptional 5.0% |