Estonian vs Cambodian Unemployment
COMPARE
Estonian
Cambodian
Unemployment
Unemployment Comparison
Estonians
Cambodians
5.0%
UNEMPLOYMENT
94.6/ 100
METRIC RATING
100th/ 347
METRIC RANK
4.9%
UNEMPLOYMENT
99.0/ 100
METRIC RATING
61st/ 347
METRIC RANK
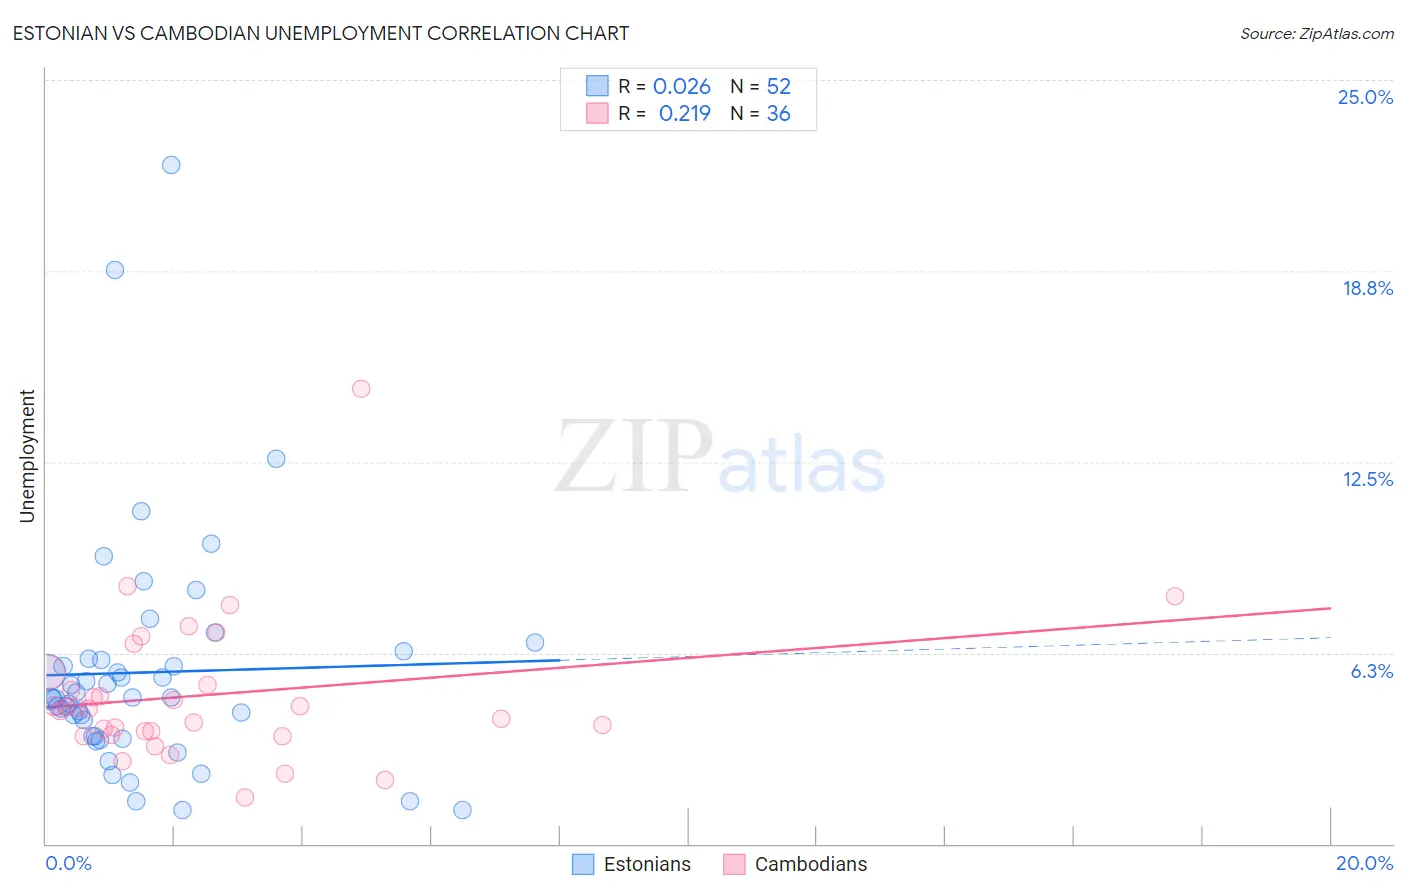
Estonian vs Cambodian Unemployment Correlation Chart
The statistical analysis conducted on geographies consisting of 123,457,467 people shows no correlation between the proportion of Estonians and unemployment in the United States with a correlation coefficient (R) of 0.026 and weighted average of 5.0%. Similarly, the statistical analysis conducted on geographies consisting of 102,491,878 people shows a weak positive correlation between the proportion of Cambodians and unemployment in the United States with a correlation coefficient (R) of 0.219 and weighted average of 4.9%, a difference of 2.8%.
Unemployment Correlation Summary
| Measurement | Estonian | Cambodian |
| Minimum | 1.1% | 1.5% |
| Maximum | 22.2% | 14.9% |
| Range | 21.1% | 13.4% |
| Mean | 5.6% | 4.9% |
| Median | 4.8% | 4.4% |
| Interquartile 25% (IQ1) | 3.5% | 3.6% |
| Interquartile 75% (IQ3) | 6.0% | 5.4% |
| Interquartile Range (IQR) | 2.5% | 1.8% |
| Standard Deviation (Sample) | 3.8% | 2.4% |
| Standard Deviation (Population) | 3.8% | 2.4% |
Similar Demographics by Unemployment
Demographics Similar to Estonians by Unemployment
In terms of unemployment, the demographic groups most similar to Estonians are Mongolian (5.0%, a difference of 0.060%), American (5.0%, a difference of 0.10%), Romanian (5.0%, a difference of 0.13%), Immigrants from Argentina (5.0%, a difference of 0.14%), and Immigrants from Czechoslovakia (5.0%, a difference of 0.16%).
| Demographics | Rating | Rank | Unemployment |
| Ukrainians | 96.0 /100 | #93 | Exceptional 5.0% |
| Immigrants | Austria | 95.9 /100 | #94 | Exceptional 5.0% |
| Immigrants | Serbia | 95.6 /100 | #95 | Exceptional 5.0% |
| Immigrants | England | 95.2 /100 | #96 | Exceptional 5.0% |
| Immigrants | Czechoslovakia | 95.1 /100 | #97 | Exceptional 5.0% |
| Romanians | 95.0 /100 | #98 | Exceptional 5.0% |
| Mongolians | 94.8 /100 | #99 | Exceptional 5.0% |
| Estonians | 94.6 /100 | #100 | Exceptional 5.0% |
| Americans | 94.3 /100 | #101 | Exceptional 5.0% |
| Immigrants | Argentina | 94.1 /100 | #102 | Exceptional 5.0% |
| Chickasaw | 94.0 /100 | #103 | Exceptional 5.0% |
| Osage | 94.0 /100 | #104 | Exceptional 5.0% |
| Maltese | 94.0 /100 | #105 | Exceptional 5.0% |
| Immigrants | Romania | 93.7 /100 | #106 | Exceptional 5.0% |
| Immigrants | Turkey | 93.7 /100 | #107 | Exceptional 5.0% |
Demographics Similar to Cambodians by Unemployment
In terms of unemployment, the demographic groups most similar to Cambodians are Immigrants from Netherlands (4.9%, a difference of 0.0%), Icelander (4.9%, a difference of 0.010%), Immigrants from Bulgaria (4.9%, a difference of 0.030%), Bhutanese (4.9%, a difference of 0.050%), and Greek (4.9%, a difference of 0.070%).
| Demographics | Rating | Rank | Unemployment |
| Eastern Europeans | 99.2 /100 | #54 | Exceptional 4.9% |
| Australians | 99.2 /100 | #55 | Exceptional 4.9% |
| Celtics | 99.1 /100 | #56 | Exceptional 4.9% |
| Immigrants | Singapore | 99.1 /100 | #57 | Exceptional 4.9% |
| Greeks | 99.0 /100 | #58 | Exceptional 4.9% |
| Bhutanese | 99.0 /100 | #59 | Exceptional 4.9% |
| Immigrants | Netherlands | 99.0 /100 | #60 | Exceptional 4.9% |
| Cambodians | 99.0 /100 | #61 | Exceptional 4.9% |
| Icelanders | 98.9 /100 | #62 | Exceptional 4.9% |
| Immigrants | Bulgaria | 98.9 /100 | #63 | Exceptional 4.9% |
| Italians | 98.9 /100 | #64 | Exceptional 4.9% |
| Immigrants | Canada | 98.8 /100 | #65 | Exceptional 4.9% |
| Slovaks | 98.7 /100 | #66 | Exceptional 4.9% |
| New Zealanders | 98.6 /100 | #67 | Exceptional 4.9% |
| Slavs | 98.6 /100 | #68 | Exceptional 4.9% |