Estonian vs Sri Lankan Unemployment
COMPARE
Estonian
Sri Lankan
Unemployment
Unemployment Comparison
Estonians
Sri Lankans
5.0%
UNEMPLOYMENT
94.6/ 100
METRIC RATING
100th/ 347
METRIC RANK
5.2%
UNEMPLOYMENT
69.5/ 100
METRIC RATING
157th/ 347
METRIC RANK
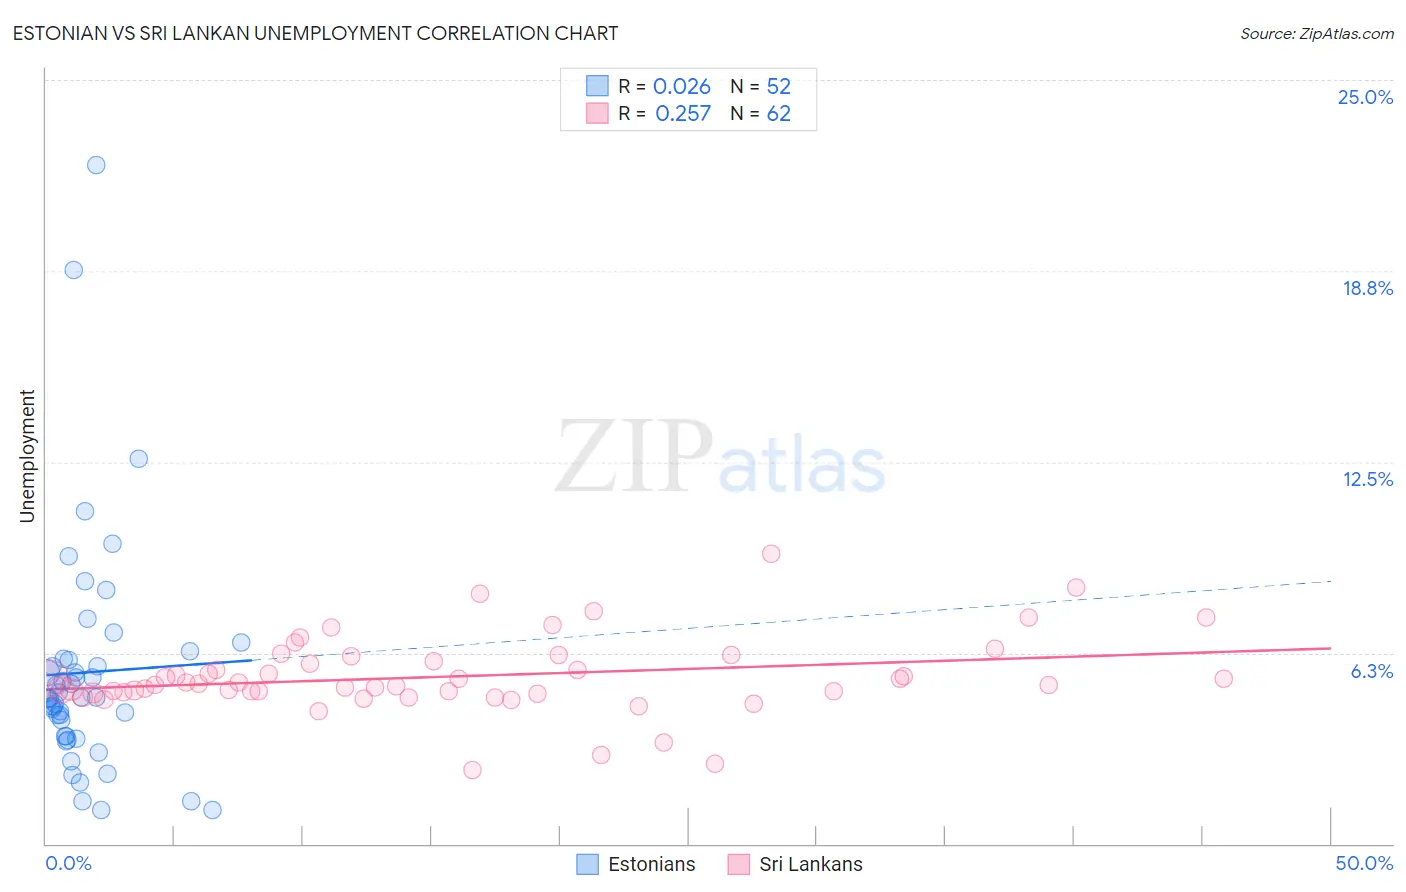
Estonian vs Sri Lankan Unemployment Correlation Chart
The statistical analysis conducted on geographies consisting of 123,457,467 people shows no correlation between the proportion of Estonians and unemployment in the United States with a correlation coefficient (R) of 0.026 and weighted average of 5.0%. Similarly, the statistical analysis conducted on geographies consisting of 440,052,205 people shows a weak positive correlation between the proportion of Sri Lankans and unemployment in the United States with a correlation coefficient (R) of 0.257 and weighted average of 5.2%, a difference of 3.3%.
Unemployment Correlation Summary
| Measurement | Estonian | Sri Lankan |
| Minimum | 1.1% | 2.4% |
| Maximum | 22.2% | 9.5% |
| Range | 21.1% | 7.1% |
| Mean | 5.6% | 5.5% |
| Median | 4.8% | 5.2% |
| Interquartile 25% (IQ1) | 3.5% | 5.0% |
| Interquartile 75% (IQ3) | 6.0% | 6.0% |
| Interquartile Range (IQR) | 2.5% | 1.0% |
| Standard Deviation (Sample) | 3.8% | 1.2% |
| Standard Deviation (Population) | 3.8% | 1.2% |
Similar Demographics by Unemployment
Demographics Similar to Estonians by Unemployment
In terms of unemployment, the demographic groups most similar to Estonians are Mongolian (5.0%, a difference of 0.060%), American (5.0%, a difference of 0.10%), Romanian (5.0%, a difference of 0.13%), Immigrants from Argentina (5.0%, a difference of 0.14%), and Immigrants from Czechoslovakia (5.0%, a difference of 0.16%).
| Demographics | Rating | Rank | Unemployment |
| Ukrainians | 96.0 /100 | #93 | Exceptional 5.0% |
| Immigrants | Austria | 95.9 /100 | #94 | Exceptional 5.0% |
| Immigrants | Serbia | 95.6 /100 | #95 | Exceptional 5.0% |
| Immigrants | England | 95.2 /100 | #96 | Exceptional 5.0% |
| Immigrants | Czechoslovakia | 95.1 /100 | #97 | Exceptional 5.0% |
| Romanians | 95.0 /100 | #98 | Exceptional 5.0% |
| Mongolians | 94.8 /100 | #99 | Exceptional 5.0% |
| Estonians | 94.6 /100 | #100 | Exceptional 5.0% |
| Americans | 94.3 /100 | #101 | Exceptional 5.0% |
| Immigrants | Argentina | 94.1 /100 | #102 | Exceptional 5.0% |
| Chickasaw | 94.0 /100 | #103 | Exceptional 5.0% |
| Osage | 94.0 /100 | #104 | Exceptional 5.0% |
| Maltese | 94.0 /100 | #105 | Exceptional 5.0% |
| Immigrants | Romania | 93.7 /100 | #106 | Exceptional 5.0% |
| Immigrants | Turkey | 93.7 /100 | #107 | Exceptional 5.0% |
Demographics Similar to Sri Lankans by Unemployment
In terms of unemployment, the demographic groups most similar to Sri Lankans are Immigrants from Kazakhstan (5.2%, a difference of 0.060%), Immigrants from Northern Africa (5.2%, a difference of 0.13%), Immigrants from Egypt (5.2%, a difference of 0.20%), Immigrants from Russia (5.2%, a difference of 0.20%), and Laotian (5.2%, a difference of 0.23%).
| Demographics | Rating | Rank | Unemployment |
| Potawatomi | 76.2 /100 | #150 | Good 5.2% |
| Immigrants | Eastern Europe | 75.3 /100 | #151 | Good 5.2% |
| Immigrants | Hong Kong | 75.2 /100 | #152 | Good 5.2% |
| Egyptians | 75.2 /100 | #153 | Good 5.2% |
| Immigrants | China | 74.7 /100 | #154 | Good 5.2% |
| Immigrants | Northern Africa | 71.3 /100 | #155 | Good 5.2% |
| Immigrants | Kazakhstan | 70.4 /100 | #156 | Good 5.2% |
| Sri Lankans | 69.5 /100 | #157 | Good 5.2% |
| Immigrants | Egypt | 66.7 /100 | #158 | Good 5.2% |
| Immigrants | Russia | 66.6 /100 | #159 | Good 5.2% |
| Laotians | 66.3 /100 | #160 | Good 5.2% |
| Immigrants | Oceania | 65.2 /100 | #161 | Good 5.2% |
| Spanish | 65.1 /100 | #162 | Good 5.2% |
| Immigrants | Zaire | 64.7 /100 | #163 | Good 5.2% |
| Immigrants | Colombia | 64.7 /100 | #164 | Good 5.2% |