Estonian vs Immigrants from Syria Unemployment
COMPARE
Estonian
Immigrants from Syria
Unemployment
Unemployment Comparison
Estonians
Immigrants from Syria
5.0%
UNEMPLOYMENT
94.6/ 100
METRIC RATING
100th/ 347
METRIC RANK
5.5%
UNEMPLOYMENT
4.8/ 100
METRIC RATING
233rd/ 347
METRIC RANK
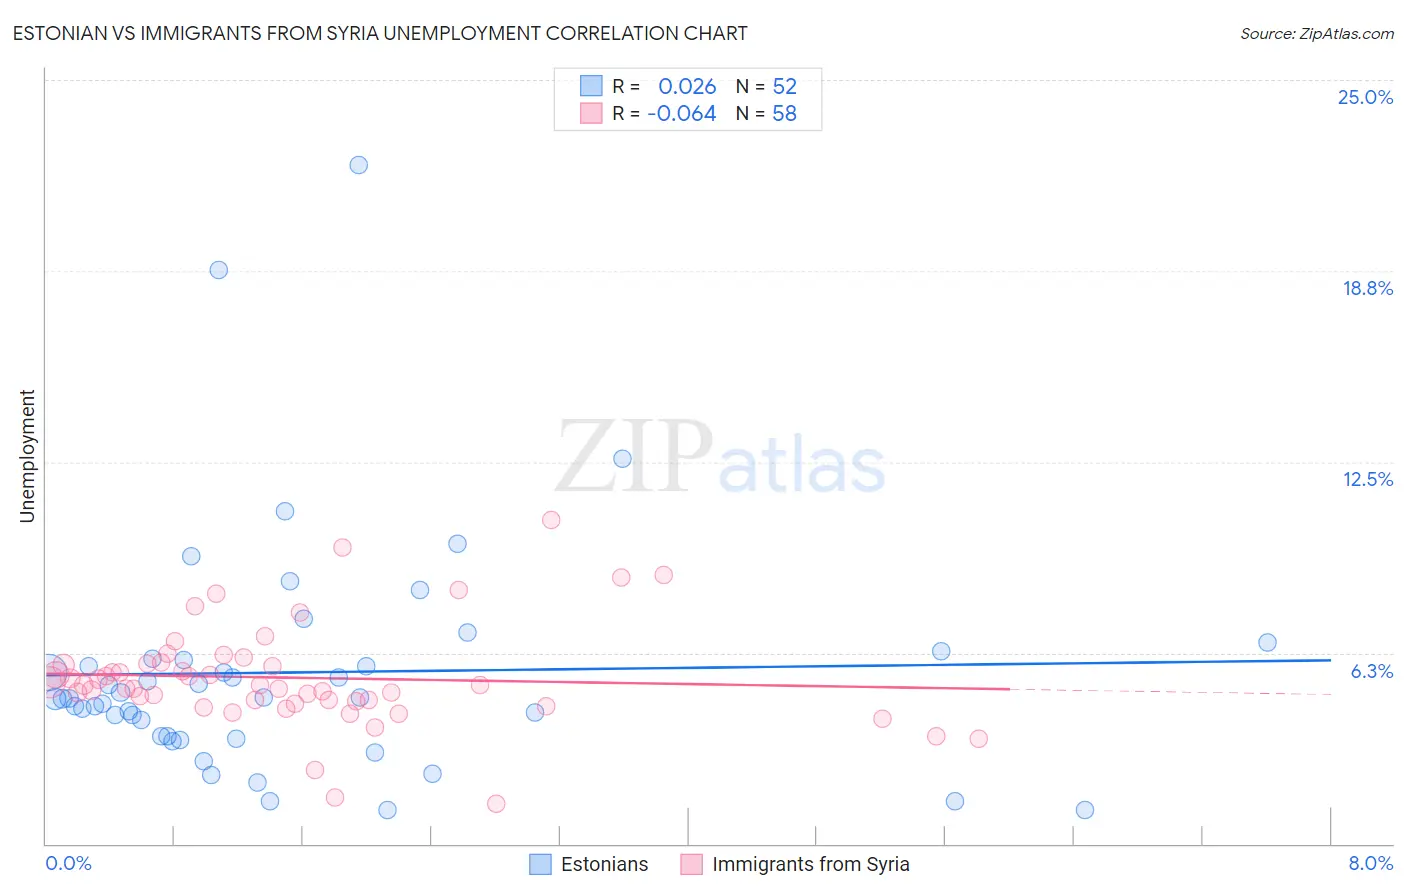
Estonian vs Immigrants from Syria Unemployment Correlation Chart
The statistical analysis conducted on geographies consisting of 123,457,467 people shows no correlation between the proportion of Estonians and unemployment in the United States with a correlation coefficient (R) of 0.026 and weighted average of 5.0%. Similarly, the statistical analysis conducted on geographies consisting of 173,974,388 people shows a slight negative correlation between the proportion of Immigrants from Syria and unemployment in the United States with a correlation coefficient (R) of -0.064 and weighted average of 5.5%, a difference of 9.4%.
Unemployment Correlation Summary
| Measurement | Estonian | Immigrants from Syria |
| Minimum | 1.1% | 1.3% |
| Maximum | 22.2% | 10.6% |
| Range | 21.1% | 9.3% |
| Mean | 5.6% | 5.4% |
| Median | 4.8% | 5.2% |
| Interquartile 25% (IQ1) | 3.5% | 4.7% |
| Interquartile 75% (IQ3) | 6.0% | 5.9% |
| Interquartile Range (IQR) | 2.5% | 1.2% |
| Standard Deviation (Sample) | 3.8% | 1.7% |
| Standard Deviation (Population) | 3.8% | 1.7% |
Similar Demographics by Unemployment
Demographics Similar to Estonians by Unemployment
In terms of unemployment, the demographic groups most similar to Estonians are Mongolian (5.0%, a difference of 0.060%), American (5.0%, a difference of 0.10%), Romanian (5.0%, a difference of 0.13%), Immigrants from Argentina (5.0%, a difference of 0.14%), and Immigrants from Czechoslovakia (5.0%, a difference of 0.16%).
| Demographics | Rating | Rank | Unemployment |
| Ukrainians | 96.0 /100 | #93 | Exceptional 5.0% |
| Immigrants | Austria | 95.9 /100 | #94 | Exceptional 5.0% |
| Immigrants | Serbia | 95.6 /100 | #95 | Exceptional 5.0% |
| Immigrants | England | 95.2 /100 | #96 | Exceptional 5.0% |
| Immigrants | Czechoslovakia | 95.1 /100 | #97 | Exceptional 5.0% |
| Romanians | 95.0 /100 | #98 | Exceptional 5.0% |
| Mongolians | 94.8 /100 | #99 | Exceptional 5.0% |
| Estonians | 94.6 /100 | #100 | Exceptional 5.0% |
| Americans | 94.3 /100 | #101 | Exceptional 5.0% |
| Immigrants | Argentina | 94.1 /100 | #102 | Exceptional 5.0% |
| Chickasaw | 94.0 /100 | #103 | Exceptional 5.0% |
| Osage | 94.0 /100 | #104 | Exceptional 5.0% |
| Maltese | 94.0 /100 | #105 | Exceptional 5.0% |
| Immigrants | Romania | 93.7 /100 | #106 | Exceptional 5.0% |
| Immigrants | Turkey | 93.7 /100 | #107 | Exceptional 5.0% |
Demographics Similar to Immigrants from Syria by Unemployment
In terms of unemployment, the demographic groups most similar to Immigrants from Syria are Panamanian (5.5%, a difference of 0.030%), Immigrants from Africa (5.5%, a difference of 0.050%), Comanche (5.5%, a difference of 0.050%), Hawaiian (5.5%, a difference of 0.18%), and Ottawa (5.5%, a difference of 0.18%).
| Demographics | Rating | Rank | Unemployment |
| Samoans | 7.1 /100 | #226 | Tragic 5.5% |
| Immigrants | Lebanon | 7.0 /100 | #227 | Tragic 5.5% |
| Guamanians/Chamorros | 6.3 /100 | #228 | Tragic 5.5% |
| Hawaiians | 5.4 /100 | #229 | Tragic 5.5% |
| Ottawa | 5.4 /100 | #230 | Tragic 5.5% |
| Immigrants | Africa | 4.9 /100 | #231 | Tragic 5.5% |
| Comanche | 4.9 /100 | #232 | Tragic 5.5% |
| Immigrants | Syria | 4.8 /100 | #233 | Tragic 5.5% |
| Panamanians | 4.7 /100 | #234 | Tragic 5.5% |
| Immigrants | Panama | 3.4 /100 | #235 | Tragic 5.5% |
| Immigrants | Cambodia | 3.3 /100 | #236 | Tragic 5.5% |
| Moroccans | 3.2 /100 | #237 | Tragic 5.5% |
| Immigrants | Western Asia | 2.8 /100 | #238 | Tragic 5.5% |
| Immigrants | Immigrants | 2.6 /100 | #239 | Tragic 5.5% |
| Cree | 2.6 /100 | #240 | Tragic 5.6% |