Danish vs Costa Rican Male Unemployment
COMPARE
Danish
Costa Rican
Male Unemployment
Male Unemployment Comparison
Danes
Costa Ricans
4.5%
MALE UNEMPLOYMENT
100.0/ 100
METRIC RATING
5th/ 347
METRIC RANK
5.4%
MALE UNEMPLOYMENT
31.3/ 100
METRIC RATING
187th/ 347
METRIC RANK
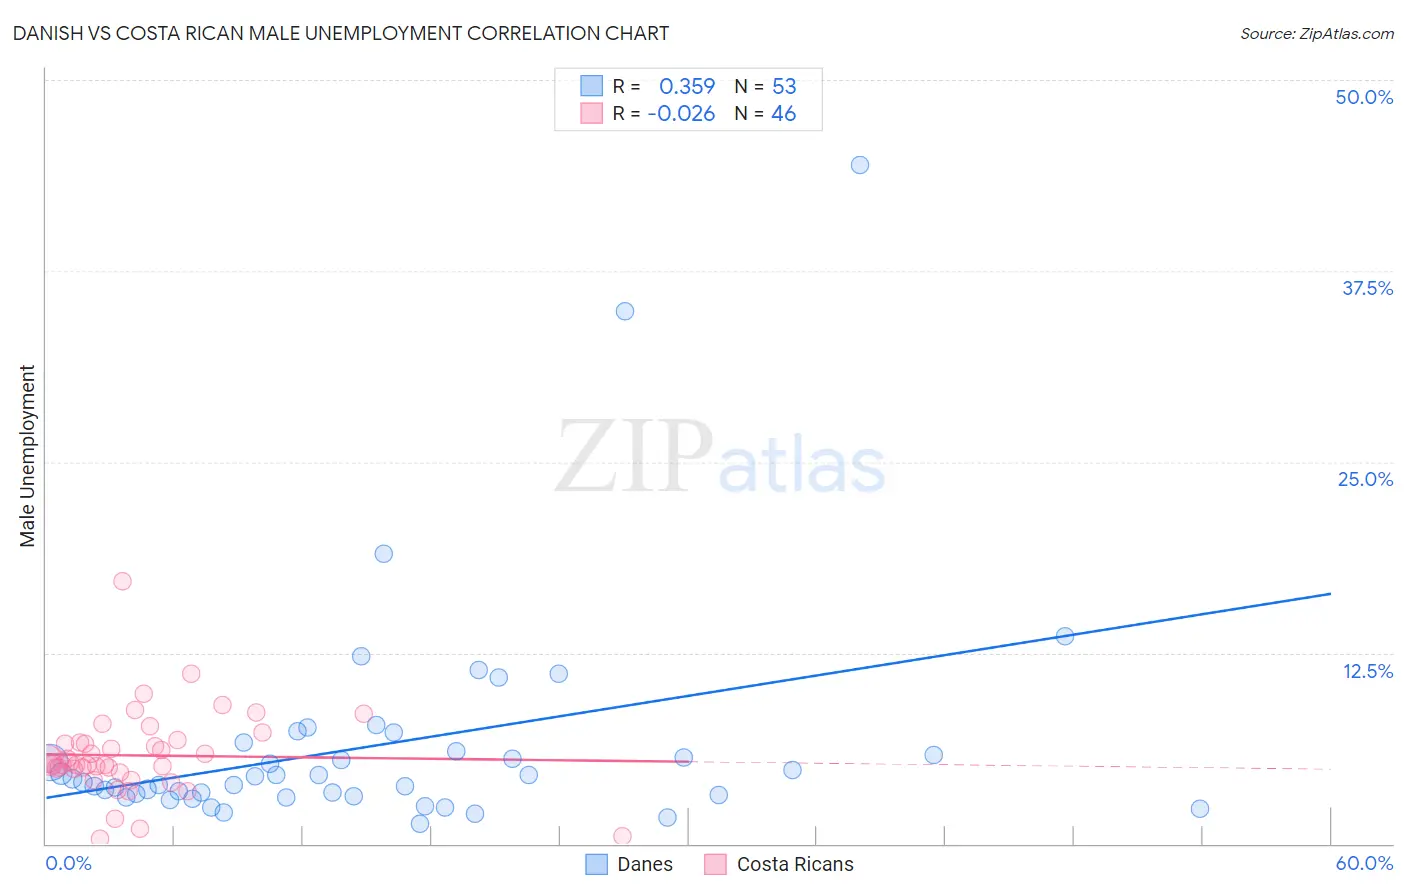
Danish vs Costa Rican Male Unemployment Correlation Chart
The statistical analysis conducted on geographies consisting of 469,242,434 people shows a mild positive correlation between the proportion of Danes and unemployment rate among males in the United States with a correlation coefficient (R) of 0.359 and weighted average of 4.5%. Similarly, the statistical analysis conducted on geographies consisting of 253,200,475 people shows no correlation between the proportion of Costa Ricans and unemployment rate among males in the United States with a correlation coefficient (R) of -0.026 and weighted average of 5.4%, a difference of 19.1%.
Male Unemployment Correlation Summary
| Measurement | Danish | Costa Rican |
| Minimum | 1.3% | 0.35% |
| Maximum | 44.4% | 17.2% |
| Range | 43.1% | 16.8% |
| Mean | 6.5% | 5.8% |
| Median | 4.3% | 5.2% |
| Interquartile 25% (IQ1) | 3.1% | 4.9% |
| Interquartile 75% (IQ3) | 6.3% | 6.6% |
| Interquartile Range (IQR) | 3.2% | 1.8% |
| Standard Deviation (Sample) | 7.5% | 2.8% |
| Standard Deviation (Population) | 7.4% | 2.8% |
Similar Demographics by Male Unemployment
Demographics Similar to Danes by Male Unemployment
In terms of male unemployment, the demographic groups most similar to Danes are Venezuelan (4.5%, a difference of 0.45%), Czech (4.5%, a difference of 0.65%), Luxembourger (4.5%, a difference of 0.91%), Immigrants from Venezuela (4.4%, a difference of 1.0%), and Norwegian (4.4%, a difference of 1.4%).
| Demographics | Rating | Rank | Male Unemployment |
| Immigrants | India | 100.0 /100 | #1 | Exceptional 4.4% |
| Immigrants | Cuba | 100.0 /100 | #2 | Exceptional 4.4% |
| Norwegians | 100.0 /100 | #3 | Exceptional 4.4% |
| Immigrants | Venezuela | 100.0 /100 | #4 | Exceptional 4.4% |
| Danes | 100.0 /100 | #5 | Exceptional 4.5% |
| Venezuelans | 100.0 /100 | #6 | Exceptional 4.5% |
| Czechs | 100.0 /100 | #7 | Exceptional 4.5% |
| Luxembourgers | 100.0 /100 | #8 | Exceptional 4.5% |
| Thais | 100.0 /100 | #9 | Exceptional 4.6% |
| Cubans | 100.0 /100 | #10 | Exceptional 4.6% |
| Swedes | 100.0 /100 | #11 | Exceptional 4.6% |
| Immigrants | Bolivia | 100.0 /100 | #12 | Exceptional 4.7% |
| Bolivians | 100.0 /100 | #13 | Exceptional 4.7% |
| Germans | 100.0 /100 | #14 | Exceptional 4.7% |
| Scandinavians | 100.0 /100 | #15 | Exceptional 4.7% |
Demographics Similar to Costa Ricans by Male Unemployment
In terms of male unemployment, the demographic groups most similar to Costa Ricans are Iraqi (5.4%, a difference of 0.010%), Arab (5.4%, a difference of 0.080%), Immigrants from South America (5.4%, a difference of 0.13%), Immigrants from Uganda (5.4%, a difference of 0.18%), and Immigrants from South Eastern Asia (5.4%, a difference of 0.21%).
| Demographics | Rating | Rank | Male Unemployment |
| Malaysians | 39.6 /100 | #180 | Fair 5.3% |
| Immigrants | Afghanistan | 37.9 /100 | #181 | Fair 5.3% |
| Potawatomi | 37.8 /100 | #182 | Fair 5.3% |
| Taiwanese | 37.6 /100 | #183 | Fair 5.3% |
| Spaniards | 35.1 /100 | #184 | Fair 5.3% |
| Koreans | 34.9 /100 | #185 | Fair 5.3% |
| Iraqis | 31.6 /100 | #186 | Fair 5.4% |
| Costa Ricans | 31.3 /100 | #187 | Fair 5.4% |
| Arabs | 30.2 /100 | #188 | Fair 5.4% |
| Immigrants | South America | 29.4 /100 | #189 | Fair 5.4% |
| Immigrants | Uganda | 28.8 /100 | #190 | Fair 5.4% |
| Immigrants | South Eastern Asia | 28.2 /100 | #191 | Fair 5.4% |
| Immigrants | Belarus | 26.0 /100 | #192 | Fair 5.4% |
| Immigrants | Israel | 25.2 /100 | #193 | Fair 5.4% |
| Spanish | 19.7 /100 | #194 | Poor 5.4% |