Danish vs Immigrants from South Africa Male Unemployment
COMPARE
Danish
Immigrants from South Africa
Male Unemployment
Male Unemployment Comparison
Danes
Immigrants from South Africa
4.5%
MALE UNEMPLOYMENT
100.0/ 100
METRIC RATING
5th/ 347
METRIC RANK
5.0%
MALE UNEMPLOYMENT
97.1/ 100
METRIC RATING
72nd/ 347
METRIC RANK
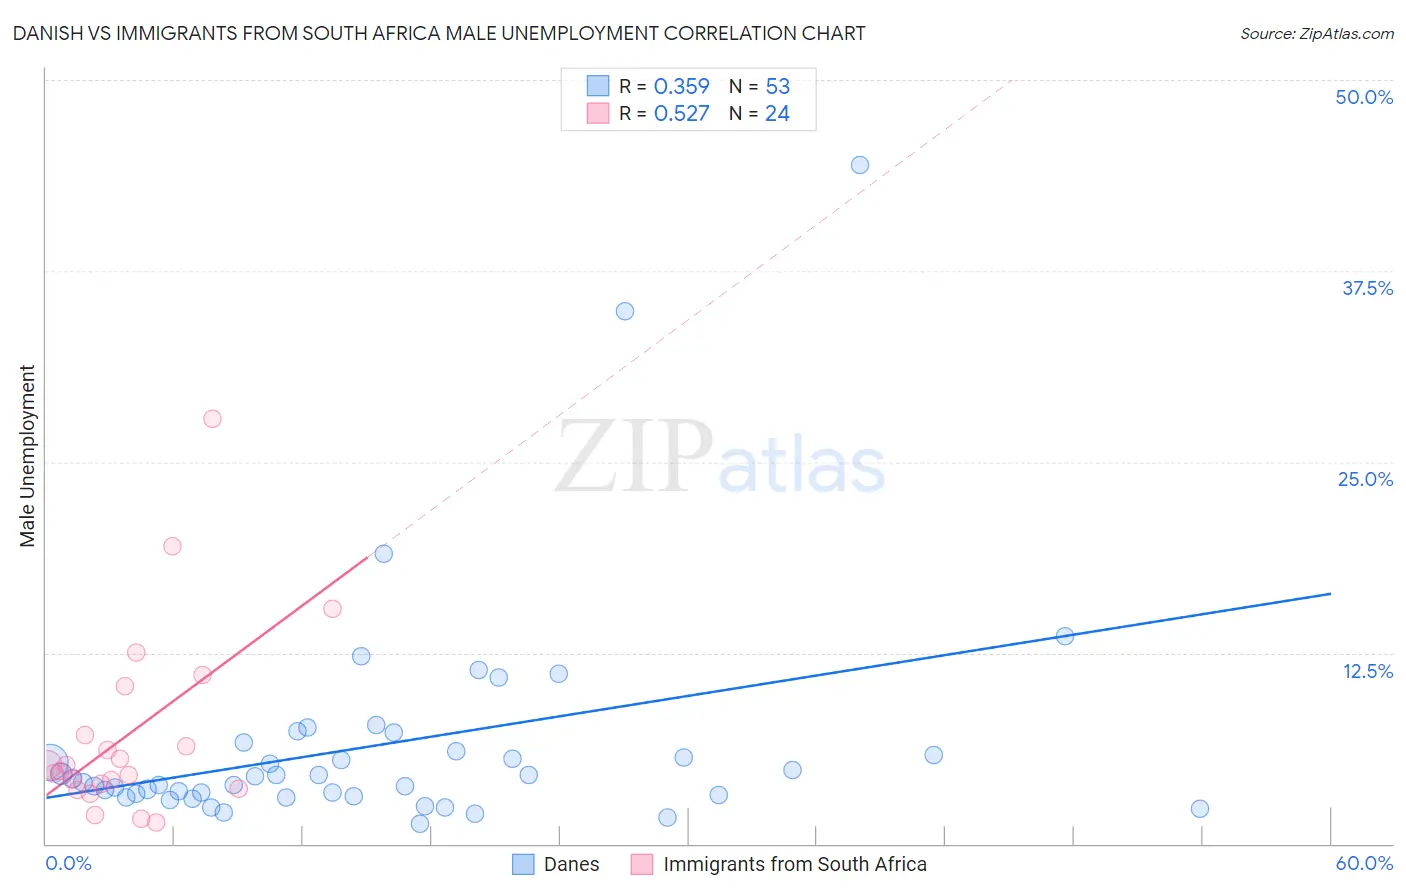
Danish vs Immigrants from South Africa Male Unemployment Correlation Chart
The statistical analysis conducted on geographies consisting of 469,242,434 people shows a mild positive correlation between the proportion of Danes and unemployment rate among males in the United States with a correlation coefficient (R) of 0.359 and weighted average of 4.5%. Similarly, the statistical analysis conducted on geographies consisting of 232,631,377 people shows a substantial positive correlation between the proportion of Immigrants from South Africa and unemployment rate among males in the United States with a correlation coefficient (R) of 0.527 and weighted average of 5.0%, a difference of 11.7%.
Male Unemployment Correlation Summary
| Measurement | Danish | Immigrants from South Africa |
| Minimum | 1.3% | 1.4% |
| Maximum | 44.4% | 27.8% |
| Range | 43.1% | 26.4% |
| Mean | 6.5% | 7.2% |
| Median | 4.3% | 5.0% |
| Interquartile 25% (IQ1) | 3.1% | 3.8% |
| Interquartile 75% (IQ3) | 6.3% | 8.7% |
| Interquartile Range (IQR) | 3.2% | 5.0% |
| Standard Deviation (Sample) | 7.5% | 6.2% |
| Standard Deviation (Population) | 7.4% | 6.1% |
Similar Demographics by Male Unemployment
Demographics Similar to Danes by Male Unemployment
In terms of male unemployment, the demographic groups most similar to Danes are Venezuelan (4.5%, a difference of 0.45%), Czech (4.5%, a difference of 0.65%), Luxembourger (4.5%, a difference of 0.91%), Immigrants from Venezuela (4.4%, a difference of 1.0%), and Norwegian (4.4%, a difference of 1.4%).
| Demographics | Rating | Rank | Male Unemployment |
| Immigrants | India | 100.0 /100 | #1 | Exceptional 4.4% |
| Immigrants | Cuba | 100.0 /100 | #2 | Exceptional 4.4% |
| Norwegians | 100.0 /100 | #3 | Exceptional 4.4% |
| Immigrants | Venezuela | 100.0 /100 | #4 | Exceptional 4.4% |
| Danes | 100.0 /100 | #5 | Exceptional 4.5% |
| Venezuelans | 100.0 /100 | #6 | Exceptional 4.5% |
| Czechs | 100.0 /100 | #7 | Exceptional 4.5% |
| Luxembourgers | 100.0 /100 | #8 | Exceptional 4.5% |
| Thais | 100.0 /100 | #9 | Exceptional 4.6% |
| Cubans | 100.0 /100 | #10 | Exceptional 4.6% |
| Swedes | 100.0 /100 | #11 | Exceptional 4.6% |
| Immigrants | Bolivia | 100.0 /100 | #12 | Exceptional 4.7% |
| Bolivians | 100.0 /100 | #13 | Exceptional 4.7% |
| Germans | 100.0 /100 | #14 | Exceptional 4.7% |
| Scandinavians | 100.0 /100 | #15 | Exceptional 4.7% |
Demographics Similar to Immigrants from South Africa by Male Unemployment
In terms of male unemployment, the demographic groups most similar to Immigrants from South Africa are New Zealander (5.0%, a difference of 0.070%), Greek (5.0%, a difference of 0.080%), White/Caucasian (5.0%, a difference of 0.090%), Immigrants from North America (5.0%, a difference of 0.11%), and Assyrian/Chaldean/Syriac (5.0%, a difference of 0.14%).
| Demographics | Rating | Rank | Male Unemployment |
| Icelanders | 97.6 /100 | #65 | Exceptional 5.0% |
| Finns | 97.5 /100 | #66 | Exceptional 5.0% |
| Immigrants | Canada | 97.5 /100 | #67 | Exceptional 5.0% |
| Australians | 97.4 /100 | #68 | Exceptional 5.0% |
| Immigrants | Sweden | 97.4 /100 | #69 | Exceptional 5.0% |
| Whites/Caucasians | 97.3 /100 | #70 | Exceptional 5.0% |
| New Zealanders | 97.3 /100 | #71 | Exceptional 5.0% |
| Immigrants | South Africa | 97.1 /100 | #72 | Exceptional 5.0% |
| Greeks | 97.0 /100 | #73 | Exceptional 5.0% |
| Immigrants | North America | 96.9 /100 | #74 | Exceptional 5.0% |
| Assyrians/Chaldeans/Syriacs | 96.9 /100 | #75 | Exceptional 5.0% |
| Immigrants | Sudan | 96.5 /100 | #76 | Exceptional 5.0% |
| Iranians | 96.4 /100 | #77 | Exceptional 5.0% |
| Immigrants | Northern Europe | 96.4 /100 | #78 | Exceptional 5.0% |
| South Africans | 96.4 /100 | #79 | Exceptional 5.0% |