Cuban vs Immigrants from Germany Unemployment
COMPARE
Cuban
Immigrants from Germany
Unemployment
Unemployment Comparison
Cubans
Immigrants from Germany
4.7%
UNEMPLOYMENT
99.8/ 100
METRIC RATING
28th/ 347
METRIC RANK
5.1%
UNEMPLOYMENT
90.8/ 100
METRIC RATING
118th/ 347
METRIC RANK
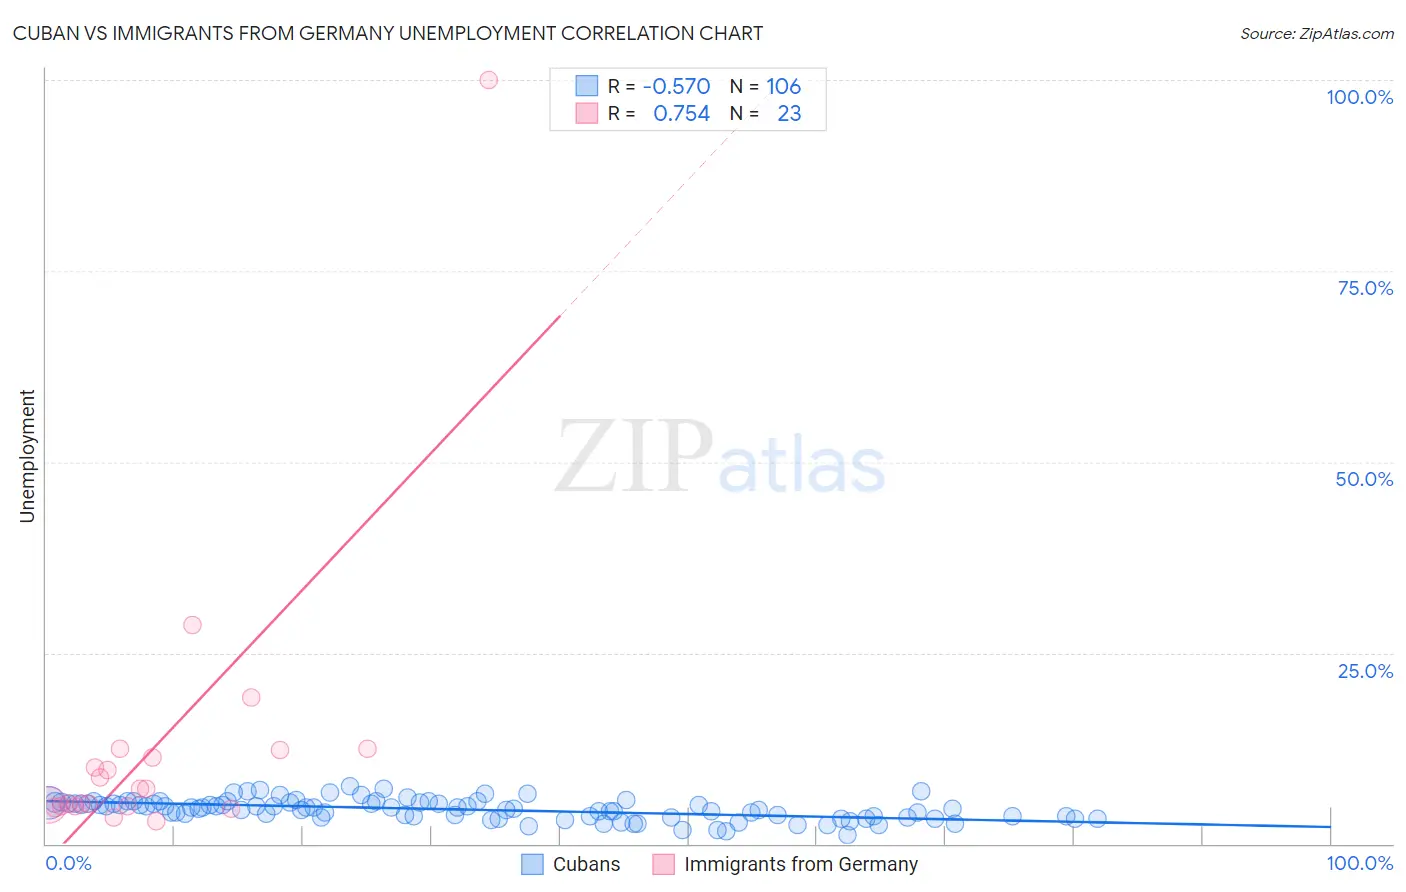
Cuban vs Immigrants from Germany Unemployment Correlation Chart
The statistical analysis conducted on geographies consisting of 448,752,139 people shows a substantial negative correlation between the proportion of Cubans and unemployment in the United States with a correlation coefficient (R) of -0.570 and weighted average of 4.7%. Similarly, the statistical analysis conducted on geographies consisting of 463,047,668 people shows a strong positive correlation between the proportion of Immigrants from Germany and unemployment in the United States with a correlation coefficient (R) of 0.754 and weighted average of 5.1%, a difference of 7.0%.
Unemployment Correlation Summary
| Measurement | Cuban | Immigrants from Germany |
| Minimum | 1.2% | 2.9% |
| Maximum | 7.6% | 100.0% |
| Range | 6.4% | 97.1% |
| Mean | 4.5% | 12.6% |
| Median | 4.7% | 7.2% |
| Interquartile 25% (IQ1) | 3.5% | 4.9% |
| Interquartile 75% (IQ3) | 5.3% | 12.2% |
| Interquartile Range (IQR) | 1.8% | 7.3% |
| Standard Deviation (Sample) | 1.3% | 19.9% |
| Standard Deviation (Population) | 1.3% | 19.5% |
Similar Demographics by Unemployment
Demographics Similar to Cubans by Unemployment
In terms of unemployment, the demographic groups most similar to Cubans are Polish (4.7%, a difference of 0.12%), Finnish (4.7%, a difference of 0.32%), Irish (4.8%, a difference of 0.36%), Croatian (4.8%, a difference of 0.38%), and Zimbabwean (4.8%, a difference of 0.48%).
| Demographics | Rating | Rank | Unemployment |
| Welsh | 99.9 /100 | #21 | Exceptional 4.7% |
| Thais | 99.9 /100 | #22 | Exceptional 4.7% |
| British | 99.9 /100 | #23 | Exceptional 4.7% |
| Venezuelans | 99.9 /100 | #24 | Exceptional 4.7% |
| Latvians | 99.9 /100 | #25 | Exceptional 4.7% |
| Bulgarians | 99.9 /100 | #26 | Exceptional 4.7% |
| Finns | 99.9 /100 | #27 | Exceptional 4.7% |
| Cubans | 99.8 /100 | #28 | Exceptional 4.7% |
| Poles | 99.8 /100 | #29 | Exceptional 4.7% |
| Irish | 99.8 /100 | #30 | Exceptional 4.8% |
| Croatians | 99.8 /100 | #31 | Exceptional 4.8% |
| Zimbabweans | 99.8 /100 | #32 | Exceptional 4.8% |
| Sudanese | 99.8 /100 | #33 | Exceptional 4.8% |
| Immigrants | Bolivia | 99.8 /100 | #34 | Exceptional 4.8% |
| Scotch-Irish | 99.8 /100 | #35 | Exceptional 4.8% |
Demographics Similar to Immigrants from Germany by Unemployment
In terms of unemployment, the demographic groups most similar to Immigrants from Germany are Immigrants from Malaysia (5.1%, a difference of 0.040%), Immigrants from Sri Lanka (5.1%, a difference of 0.050%), Immigrants from Western Europe (5.1%, a difference of 0.070%), Immigrants from France (5.1%, a difference of 0.20%), and Macedonian (5.1%, a difference of 0.21%).
| Demographics | Rating | Rank | Unemployment |
| Chileans | 93.2 /100 | #111 | Exceptional 5.0% |
| South Africans | 92.6 /100 | #112 | Exceptional 5.1% |
| Argentineans | 92.4 /100 | #113 | Exceptional 5.1% |
| Immigrants | Ireland | 92.1 /100 | #114 | Exceptional 5.1% |
| Immigrants | Western Europe | 91.1 /100 | #115 | Exceptional 5.1% |
| Immigrants | Sri Lanka | 91.1 /100 | #116 | Exceptional 5.1% |
| Immigrants | Malaysia | 91.0 /100 | #117 | Exceptional 5.1% |
| Immigrants | Germany | 90.8 /100 | #118 | Exceptional 5.1% |
| Immigrants | France | 89.7 /100 | #119 | Excellent 5.1% |
| Macedonians | 89.7 /100 | #120 | Excellent 5.1% |
| Lebanese | 89.2 /100 | #121 | Excellent 5.1% |
| Immigrants | Switzerland | 89.1 /100 | #122 | Excellent 5.1% |
| Asians | 89.0 /100 | #123 | Excellent 5.1% |
| Ethiopians | 88.6 /100 | #124 | Excellent 5.1% |
| Immigrants | Eastern Asia | 88.3 /100 | #125 | Excellent 5.1% |