Cuban vs Thai Unemployment
COMPARE
Cuban
Thai
Unemployment
Unemployment Comparison
Cubans
Thais
4.7%
UNEMPLOYMENT
99.8/ 100
METRIC RATING
28th/ 347
METRIC RANK
4.7%
UNEMPLOYMENT
99.9/ 100
METRIC RATING
22nd/ 347
METRIC RANK
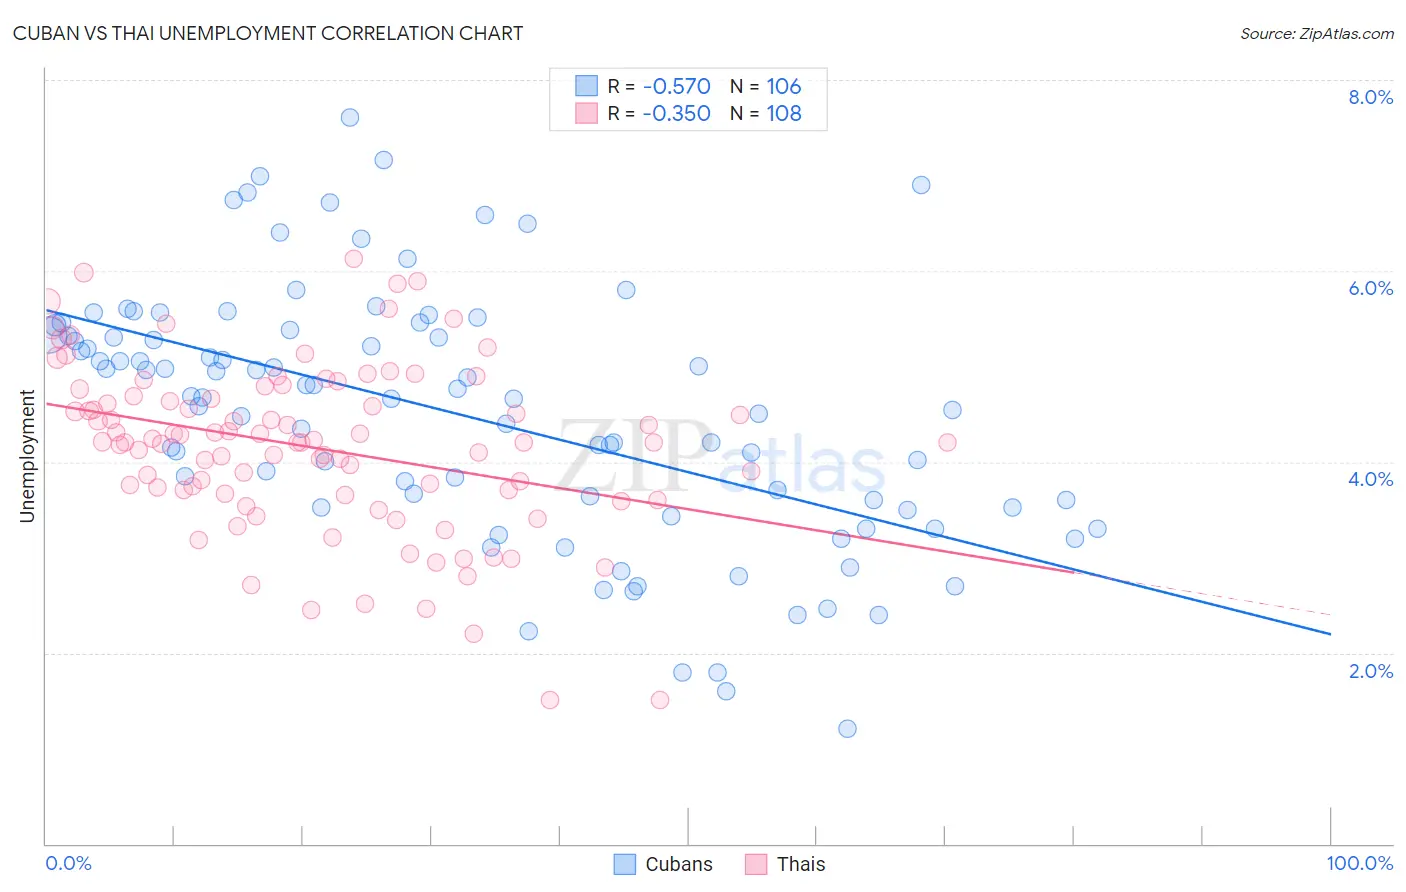
Cuban vs Thai Unemployment Correlation Chart
The statistical analysis conducted on geographies consisting of 448,752,139 people shows a substantial negative correlation between the proportion of Cubans and unemployment in the United States with a correlation coefficient (R) of -0.570 and weighted average of 4.7%. Similarly, the statistical analysis conducted on geographies consisting of 475,133,267 people shows a mild negative correlation between the proportion of Thais and unemployment in the United States with a correlation coefficient (R) of -0.350 and weighted average of 4.7%, a difference of 1.0%.
Unemployment Correlation Summary
| Measurement | Cuban | Thai |
| Minimum | 1.2% | 1.5% |
| Maximum | 7.6% | 6.1% |
| Range | 6.4% | 4.6% |
| Mean | 4.5% | 4.2% |
| Median | 4.7% | 4.2% |
| Interquartile 25% (IQ1) | 3.5% | 3.7% |
| Interquartile 75% (IQ3) | 5.3% | 4.7% |
| Interquartile Range (IQR) | 1.8% | 0.99% |
| Standard Deviation (Sample) | 1.3% | 0.89% |
| Standard Deviation (Population) | 1.3% | 0.88% |
Demographics Similar to Cubans and Thais by Unemployment
In terms of unemployment, the demographic groups most similar to Cubans are Polish (4.7%, a difference of 0.12%), Finnish (4.7%, a difference of 0.32%), Irish (4.8%, a difference of 0.36%), Croatian (4.8%, a difference of 0.38%), and Zimbabwean (4.8%, a difference of 0.48%). Similarly, the demographic groups most similar to Thais are Welsh (4.7%, a difference of 0.0%), Carpatho Rusyn (4.7%, a difference of 0.020%), British (4.7%, a difference of 0.30%), Venezuelan (4.7%, a difference of 0.38%), and Latvian (4.7%, a difference of 0.45%).
| Demographics | Rating | Rank | Unemployment |
| Europeans | 99.9 /100 | #15 | Exceptional 4.6% |
| Chinese | 99.9 /100 | #16 | Exceptional 4.7% |
| Slovenes | 99.9 /100 | #17 | Exceptional 4.7% |
| Immigrants | Venezuela | 99.9 /100 | #18 | Exceptional 4.7% |
| Scottish | 99.9 /100 | #19 | Exceptional 4.7% |
| Carpatho Rusyns | 99.9 /100 | #20 | Exceptional 4.7% |
| Welsh | 99.9 /100 | #21 | Exceptional 4.7% |
| Thais | 99.9 /100 | #22 | Exceptional 4.7% |
| British | 99.9 /100 | #23 | Exceptional 4.7% |
| Venezuelans | 99.9 /100 | #24 | Exceptional 4.7% |
| Latvians | 99.9 /100 | #25 | Exceptional 4.7% |
| Bulgarians | 99.9 /100 | #26 | Exceptional 4.7% |
| Finns | 99.9 /100 | #27 | Exceptional 4.7% |
| Cubans | 99.8 /100 | #28 | Exceptional 4.7% |
| Poles | 99.8 /100 | #29 | Exceptional 4.7% |
| Irish | 99.8 /100 | #30 | Exceptional 4.8% |
| Croatians | 99.8 /100 | #31 | Exceptional 4.8% |
| Zimbabweans | 99.8 /100 | #32 | Exceptional 4.8% |
| Sudanese | 99.8 /100 | #33 | Exceptional 4.8% |
| Immigrants | Bolivia | 99.8 /100 | #34 | Exceptional 4.8% |
| Scotch-Irish | 99.8 /100 | #35 | Exceptional 4.8% |