Cuban vs Crow Unemployment
COMPARE
Cuban
Crow
Unemployment
Unemployment Comparison
Cubans
Crow
4.7%
UNEMPLOYMENT
99.8/ 100
METRIC RATING
28th/ 347
METRIC RANK
11.1%
UNEMPLOYMENT
0.0/ 100
METRIC RATING
346th/ 347
METRIC RANK
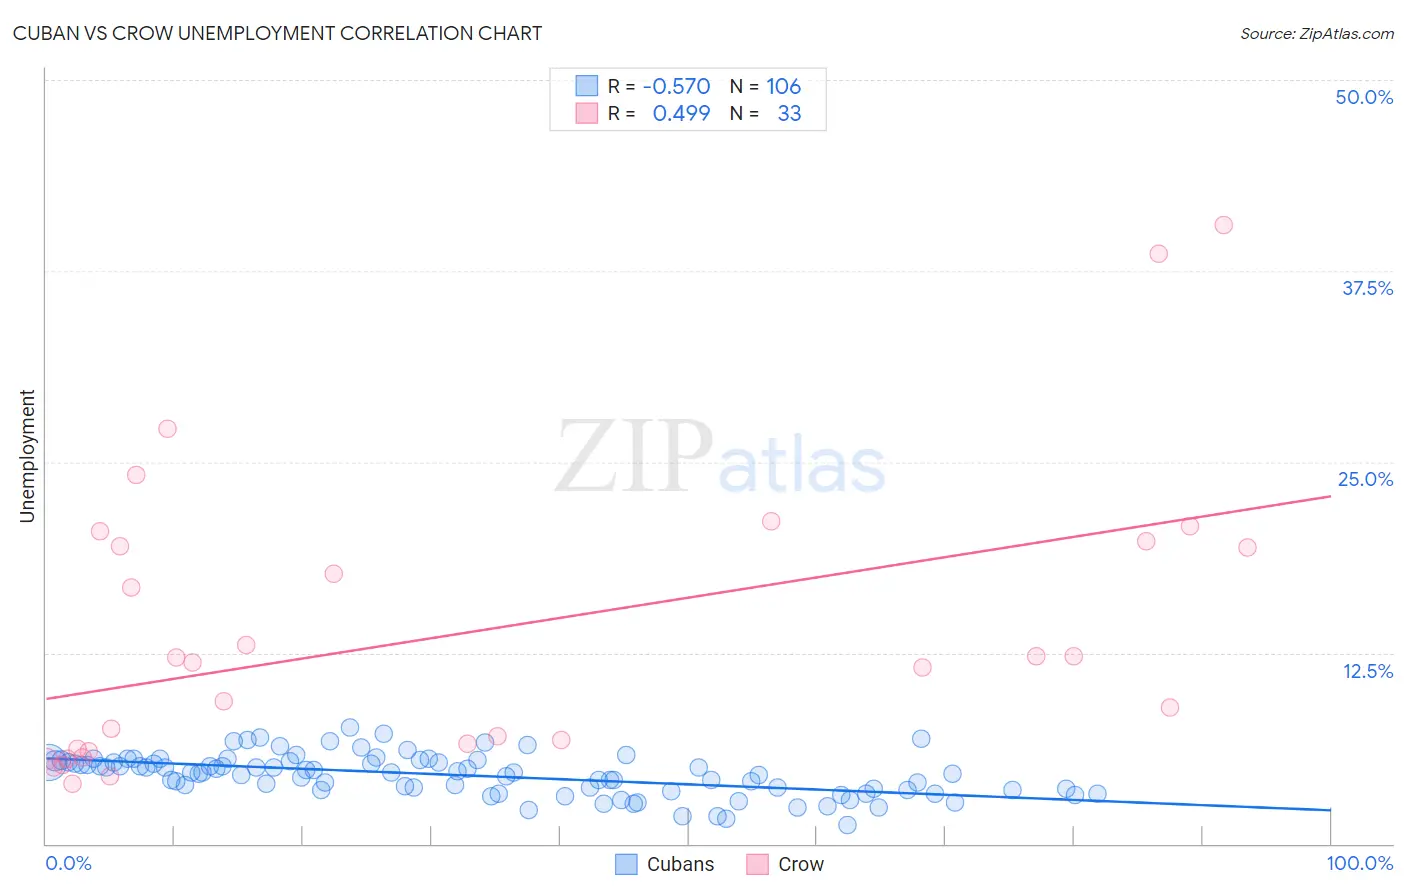
Cuban vs Crow Unemployment Correlation Chart
The statistical analysis conducted on geographies consisting of 448,752,139 people shows a substantial negative correlation between the proportion of Cubans and unemployment in the United States with a correlation coefficient (R) of -0.570 and weighted average of 4.7%. Similarly, the statistical analysis conducted on geographies consisting of 59,183,327 people shows a moderate positive correlation between the proportion of Crow and unemployment in the United States with a correlation coefficient (R) of 0.499 and weighted average of 11.1%, a difference of 133.4%.
Unemployment Correlation Summary
| Measurement | Cuban | Crow |
| Minimum | 1.2% | 3.9% |
| Maximum | 7.6% | 40.5% |
| Range | 6.4% | 36.6% |
| Mean | 4.5% | 13.7% |
| Median | 4.7% | 11.9% |
| Interquartile 25% (IQ1) | 3.5% | 6.1% |
| Interquartile 75% (IQ3) | 5.3% | 19.6% |
| Interquartile Range (IQR) | 1.8% | 13.5% |
| Standard Deviation (Sample) | 1.3% | 9.3% |
| Standard Deviation (Population) | 1.3% | 9.2% |
Similar Demographics by Unemployment
Demographics Similar to Cubans by Unemployment
In terms of unemployment, the demographic groups most similar to Cubans are Polish (4.7%, a difference of 0.12%), Finnish (4.7%, a difference of 0.32%), Irish (4.8%, a difference of 0.36%), Croatian (4.8%, a difference of 0.38%), and Zimbabwean (4.8%, a difference of 0.48%).
| Demographics | Rating | Rank | Unemployment |
| Welsh | 99.9 /100 | #21 | Exceptional 4.7% |
| Thais | 99.9 /100 | #22 | Exceptional 4.7% |
| British | 99.9 /100 | #23 | Exceptional 4.7% |
| Venezuelans | 99.9 /100 | #24 | Exceptional 4.7% |
| Latvians | 99.9 /100 | #25 | Exceptional 4.7% |
| Bulgarians | 99.9 /100 | #26 | Exceptional 4.7% |
| Finns | 99.9 /100 | #27 | Exceptional 4.7% |
| Cubans | 99.8 /100 | #28 | Exceptional 4.7% |
| Poles | 99.8 /100 | #29 | Exceptional 4.7% |
| Irish | 99.8 /100 | #30 | Exceptional 4.8% |
| Croatians | 99.8 /100 | #31 | Exceptional 4.8% |
| Zimbabweans | 99.8 /100 | #32 | Exceptional 4.8% |
| Sudanese | 99.8 /100 | #33 | Exceptional 4.8% |
| Immigrants | Bolivia | 99.8 /100 | #34 | Exceptional 4.8% |
| Scotch-Irish | 99.8 /100 | #35 | Exceptional 4.8% |
Demographics Similar to Crow by Unemployment
In terms of unemployment, the demographic groups most similar to Crow are Inupiat (10.1%, a difference of 9.4%), Arapaho (9.8%, a difference of 12.6%), Yuman (9.1%, a difference of 22.0%), Yup'ik (13.6%, a difference of 23.3%), and Hopi (8.9%, a difference of 24.1%).
| Demographics | Rating | Rank | Unemployment |
| Immigrants | Dominican Republic | 0.0 /100 | #333 | Tragic 7.4% |
| Apache | 0.0 /100 | #334 | Tragic 7.4% |
| Alaskan Athabascans | 0.0 /100 | #335 | Tragic 7.7% |
| Immigrants | Yemen | 0.0 /100 | #336 | Tragic 7.7% |
| Cheyenne | 0.0 /100 | #337 | Tragic 8.0% |
| Pima | 0.0 /100 | #338 | Tragic 8.2% |
| Navajo | 0.0 /100 | #339 | Tragic 8.4% |
| Puerto Ricans | 0.0 /100 | #340 | Tragic 8.4% |
| Tohono O'odham | 0.0 /100 | #341 | Tragic 8.9% |
| Hopi | 0.0 /100 | #342 | Tragic 8.9% |
| Yuman | 0.0 /100 | #343 | Tragic 9.1% |
| Arapaho | 0.0 /100 | #344 | Tragic 9.8% |
| Inupiat | 0.0 /100 | #345 | Tragic 10.1% |
| Crow | 0.0 /100 | #346 | Tragic 11.1% |
| Yup'ik | 0.0 /100 | #347 | Tragic 13.6% |