Finnish vs Immigrants from Hungary Male Unemployment
COMPARE
Finnish
Immigrants from Hungary
Male Unemployment
Male Unemployment Comparison
Finns
Immigrants from Hungary
5.0%
MALE UNEMPLOYMENT
97.5/ 100
METRIC RATING
66th/ 347
METRIC RANK
5.2%
MALE UNEMPLOYMENT
73.4/ 100
METRIC RATING
155th/ 347
METRIC RANK
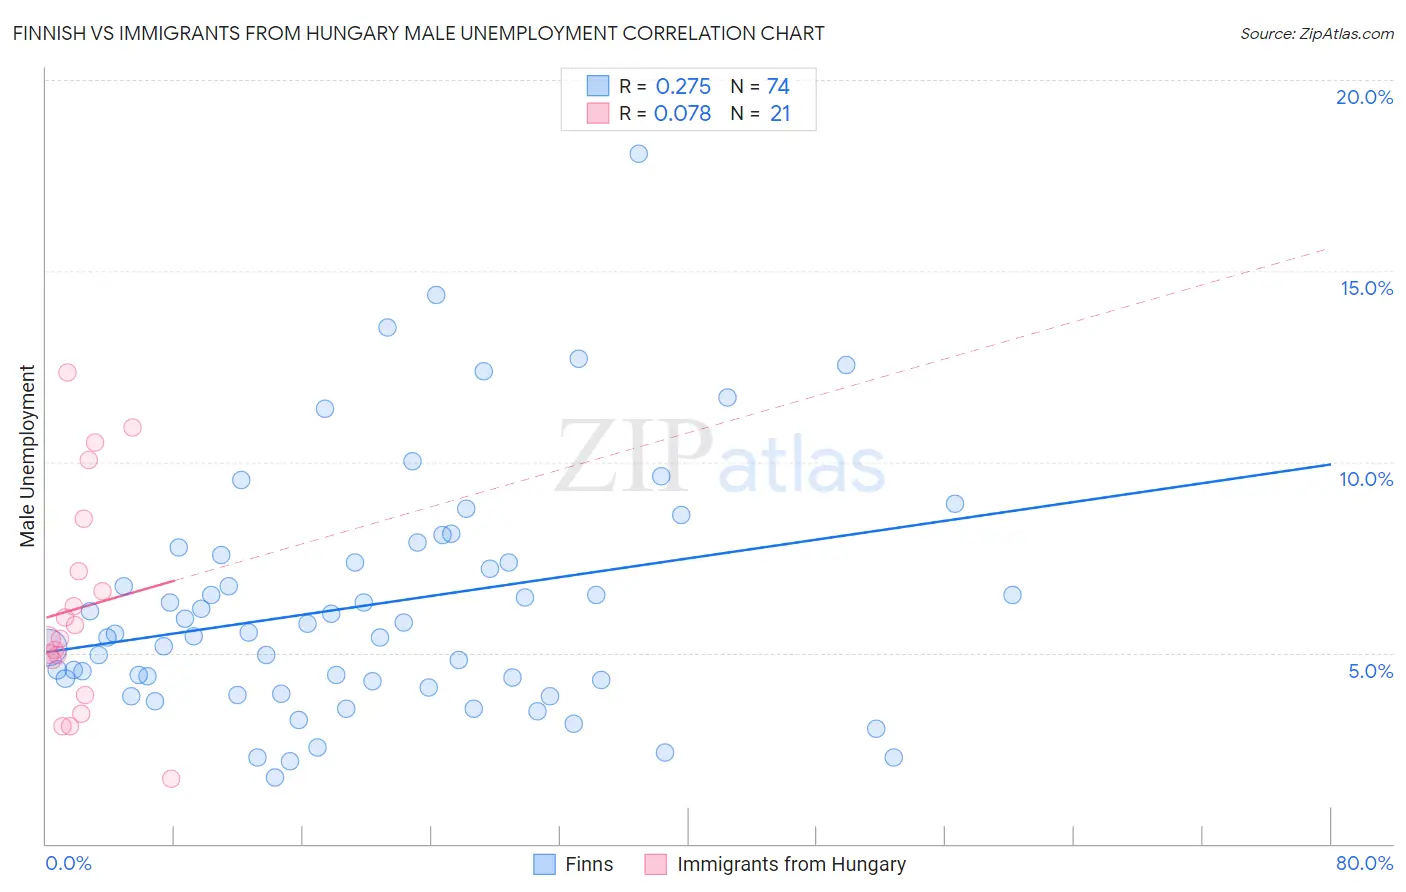
Finnish vs Immigrants from Hungary Male Unemployment Correlation Chart
The statistical analysis conducted on geographies consisting of 401,956,415 people shows a weak positive correlation between the proportion of Finns and unemployment rate among males in the United States with a correlation coefficient (R) of 0.275 and weighted average of 5.0%. Similarly, the statistical analysis conducted on geographies consisting of 195,412,330 people shows a slight positive correlation between the proportion of Immigrants from Hungary and unemployment rate among males in the United States with a correlation coefficient (R) of 0.078 and weighted average of 5.2%, a difference of 4.1%.
Male Unemployment Correlation Summary
| Measurement | Finnish | Immigrants from Hungary |
| Minimum | 1.7% | 1.7% |
| Maximum | 18.1% | 12.3% |
| Range | 16.3% | 10.6% |
| Mean | 6.3% | 6.2% |
| Median | 5.5% | 5.4% |
| Interquartile 25% (IQ1) | 4.3% | 4.4% |
| Interquartile 75% (IQ3) | 7.6% | 7.8% |
| Interquartile Range (IQR) | 3.3% | 3.5% |
| Standard Deviation (Sample) | 3.2% | 2.8% |
| Standard Deviation (Population) | 3.2% | 2.8% |
Similar Demographics by Male Unemployment
Demographics Similar to Finns by Male Unemployment
In terms of male unemployment, the demographic groups most similar to Finns are Immigrants from Canada (5.0%, a difference of 0.020%), Australian (5.0%, a difference of 0.030%), Immigrants from Sweden (5.0%, a difference of 0.060%), Icelander (5.0%, a difference of 0.090%), and White/Caucasian (5.0%, a difference of 0.11%).
| Demographics | Rating | Rank | Male Unemployment |
| Immigrants | Netherlands | 98.3 /100 | #59 | Exceptional 5.0% |
| Immigrants | Argentina | 98.1 /100 | #60 | Exceptional 5.0% |
| Cambodians | 98.1 /100 | #61 | Exceptional 5.0% |
| Basques | 97.9 /100 | #62 | Exceptional 5.0% |
| Eastern Europeans | 97.9 /100 | #63 | Exceptional 5.0% |
| Celtics | 97.8 /100 | #64 | Exceptional 5.0% |
| Icelanders | 97.6 /100 | #65 | Exceptional 5.0% |
| Finns | 97.5 /100 | #66 | Exceptional 5.0% |
| Immigrants | Canada | 97.5 /100 | #67 | Exceptional 5.0% |
| Australians | 97.4 /100 | #68 | Exceptional 5.0% |
| Immigrants | Sweden | 97.4 /100 | #69 | Exceptional 5.0% |
| Whites/Caucasians | 97.3 /100 | #70 | Exceptional 5.0% |
| New Zealanders | 97.3 /100 | #71 | Exceptional 5.0% |
| Immigrants | South Africa | 97.1 /100 | #72 | Exceptional 5.0% |
| Greeks | 97.0 /100 | #73 | Exceptional 5.0% |
Demographics Similar to Immigrants from Hungary by Male Unemployment
In terms of male unemployment, the demographic groups most similar to Immigrants from Hungary are Laotian (5.2%, a difference of 0.030%), Immigrants from Uruguay (5.2%, a difference of 0.040%), American (5.2%, a difference of 0.060%), Immigrants from Northern Africa (5.2%, a difference of 0.080%), and Egyptian (5.2%, a difference of 0.11%).
| Demographics | Rating | Rank | Male Unemployment |
| Immigrants | Italy | 76.3 /100 | #148 | Good 5.2% |
| Immigrants | Europe | 76.2 /100 | #149 | Good 5.2% |
| Indians (Asian) | 76.0 /100 | #150 | Good 5.2% |
| Slovaks | 75.5 /100 | #151 | Good 5.2% |
| Egyptians | 74.8 /100 | #152 | Good 5.2% |
| Immigrants | Uruguay | 73.9 /100 | #153 | Good 5.2% |
| Laotians | 73.8 /100 | #154 | Good 5.2% |
| Immigrants | Hungary | 73.4 /100 | #155 | Good 5.2% |
| Americans | 72.7 /100 | #156 | Good 5.2% |
| Immigrants | Northern Africa | 72.3 /100 | #157 | Good 5.2% |
| Immigrants | Indonesia | 71.5 /100 | #158 | Good 5.2% |
| Indonesians | 71.2 /100 | #159 | Good 5.2% |
| Immigrants | Norway | 71.0 /100 | #160 | Good 5.2% |
| Immigrants | China | 70.6 /100 | #161 | Good 5.2% |
| Immigrants | Egypt | 65.9 /100 | #162 | Good 5.2% |