Choctaw vs Austrian Female Unemployment
COMPARE
Choctaw
Austrian
Female Unemployment
Female Unemployment Comparison
Choctaw
Austrians
5.4%
FEMALE UNEMPLOYMENT
12.3/ 100
METRIC RATING
210th/ 347
METRIC RANK
4.9%
FEMALE UNEMPLOYMENT
99.3/ 100
METRIC RATING
45th/ 347
METRIC RANK
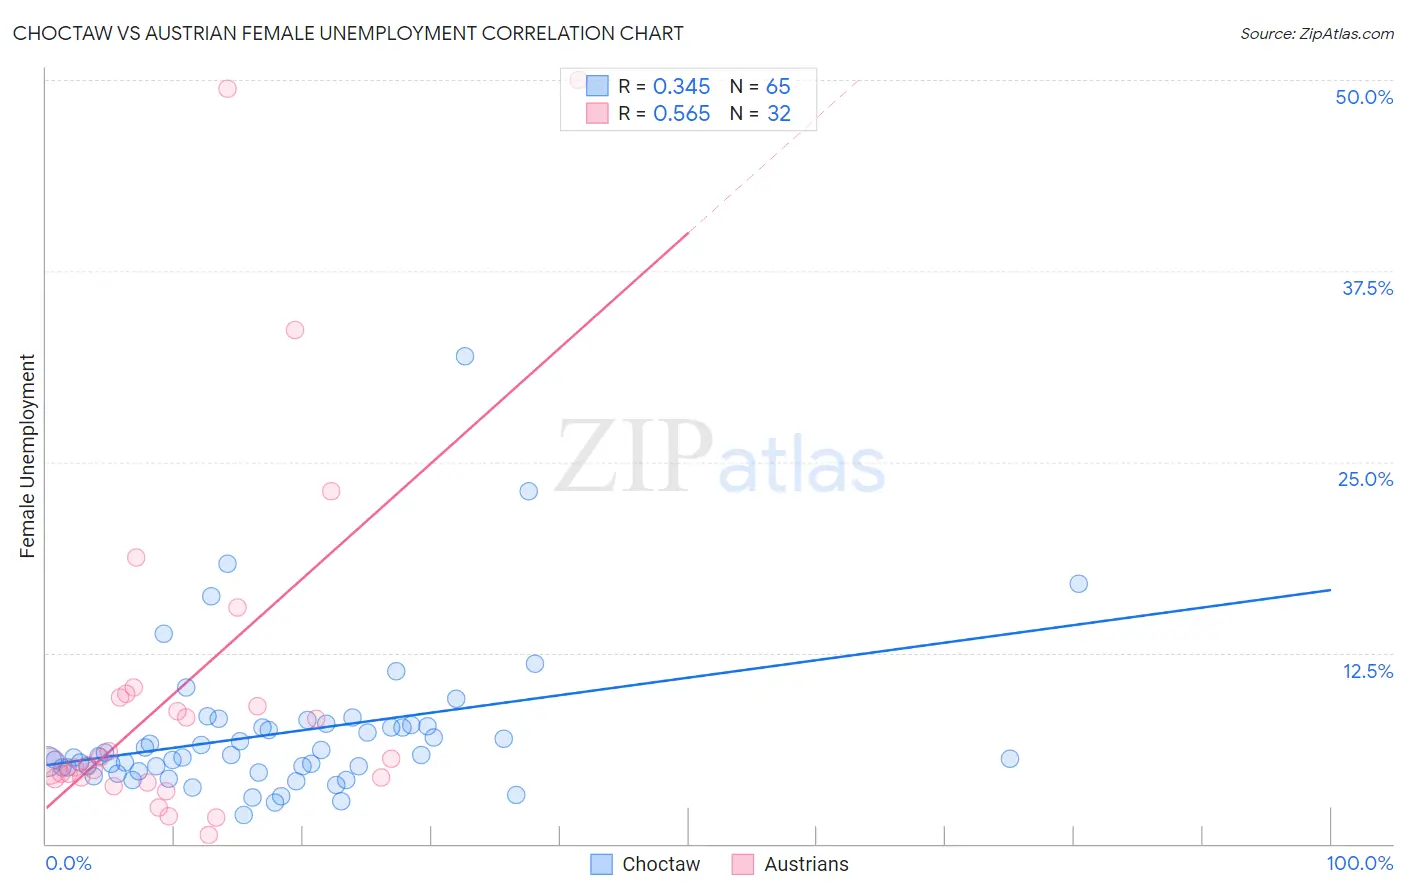
Choctaw vs Austrian Female Unemployment Correlation Chart
The statistical analysis conducted on geographies consisting of 268,280,728 people shows a mild positive correlation between the proportion of Choctaw and unemploymnet rate among females in the United States with a correlation coefficient (R) of 0.345 and weighted average of 5.4%. Similarly, the statistical analysis conducted on geographies consisting of 448,029,522 people shows a substantial positive correlation between the proportion of Austrians and unemploymnet rate among females in the United States with a correlation coefficient (R) of 0.565 and weighted average of 4.9%, a difference of 11.4%.
Female Unemployment Correlation Summary
| Measurement | Choctaw | Austrian |
| Minimum | 1.9% | 0.60% |
| Maximum | 31.9% | 50.0% |
| Range | 30.0% | 49.4% |
| Mean | 7.2% | 10.4% |
| Median | 5.7% | 5.4% |
| Interquartile 25% (IQ1) | 4.9% | 4.3% |
| Interquartile 75% (IQ3) | 7.7% | 9.7% |
| Interquartile Range (IQR) | 2.9% | 5.4% |
| Standard Deviation (Sample) | 4.9% | 12.3% |
| Standard Deviation (Population) | 4.9% | 12.1% |
Similar Demographics by Female Unemployment
Demographics Similar to Choctaw by Female Unemployment
In terms of female unemployment, the demographic groups most similar to Choctaw are Ottawa (5.4%, a difference of 0.10%), Uruguayan (5.4%, a difference of 0.12%), Korean (5.4%, a difference of 0.15%), Immigrants from Costa Rica (5.4%, a difference of 0.19%), and Samoan (5.4%, a difference of 0.23%).
| Demographics | Rating | Rank | Female Unemployment |
| Immigrants | South Eastern Asia | 20.3 /100 | #203 | Fair 5.4% |
| Immigrants | Israel | 19.7 /100 | #204 | Poor 5.4% |
| Immigrants | Afghanistan | 18.9 /100 | #205 | Poor 5.4% |
| Immigrants | Brazil | 18.8 /100 | #206 | Poor 5.4% |
| Creek | 15.4 /100 | #207 | Poor 5.4% |
| Immigrants | Costa Rica | 13.7 /100 | #208 | Poor 5.4% |
| Koreans | 13.4 /100 | #209 | Poor 5.4% |
| Choctaw | 12.3 /100 | #210 | Poor 5.4% |
| Ottawa | 11.6 /100 | #211 | Poor 5.4% |
| Uruguayans | 11.4 /100 | #212 | Poor 5.4% |
| Samoans | 10.6 /100 | #213 | Poor 5.4% |
| Seminole | 10.3 /100 | #214 | Poor 5.4% |
| Immigrants | Nicaragua | 10.2 /100 | #215 | Poor 5.4% |
| Comanche | 10.0 /100 | #216 | Poor 5.4% |
| Peruvians | 9.6 /100 | #217 | Tragic 5.4% |
Demographics Similar to Austrians by Female Unemployment
In terms of female unemployment, the demographic groups most similar to Austrians are Immigrants from Bulgaria (4.9%, a difference of 0.030%), Greek (4.9%, a difference of 0.080%), Okinawan (4.9%, a difference of 0.11%), Eastern European (4.9%, a difference of 0.18%), and Thai (4.9%, a difference of 0.31%).
| Demographics | Rating | Rank | Female Unemployment |
| Northern Europeans | 99.6 /100 | #38 | Exceptional 4.8% |
| Scotch-Irish | 99.6 /100 | #39 | Exceptional 4.8% |
| French | 99.6 /100 | #40 | Exceptional 4.8% |
| Tongans | 99.5 /100 | #41 | Exceptional 4.8% |
| Italians | 99.5 /100 | #42 | Exceptional 4.8% |
| Eastern Europeans | 99.4 /100 | #43 | Exceptional 4.9% |
| Greeks | 99.4 /100 | #44 | Exceptional 4.9% |
| Austrians | 99.3 /100 | #45 | Exceptional 4.9% |
| Immigrants | Bulgaria | 99.3 /100 | #46 | Exceptional 4.9% |
| Okinawans | 99.3 /100 | #47 | Exceptional 4.9% |
| Thais | 99.2 /100 | #48 | Exceptional 4.9% |
| Australians | 99.2 /100 | #49 | Exceptional 4.9% |
| Immigrants | Cuba | 99.1 /100 | #50 | Exceptional 4.9% |
| Cambodians | 99.1 /100 | #51 | Exceptional 4.9% |
| Slavs | 99.1 /100 | #52 | Exceptional 4.9% |