Choctaw vs Iraqi Female Unemployment
COMPARE
Choctaw
Iraqi
Female Unemployment
Female Unemployment Comparison
Choctaw
Iraqis
5.4%
FEMALE UNEMPLOYMENT
12.3/ 100
METRIC RATING
210th/ 347
METRIC RANK
5.5%
FEMALE UNEMPLOYMENT
7.1/ 100
METRIC RATING
224th/ 347
METRIC RANK
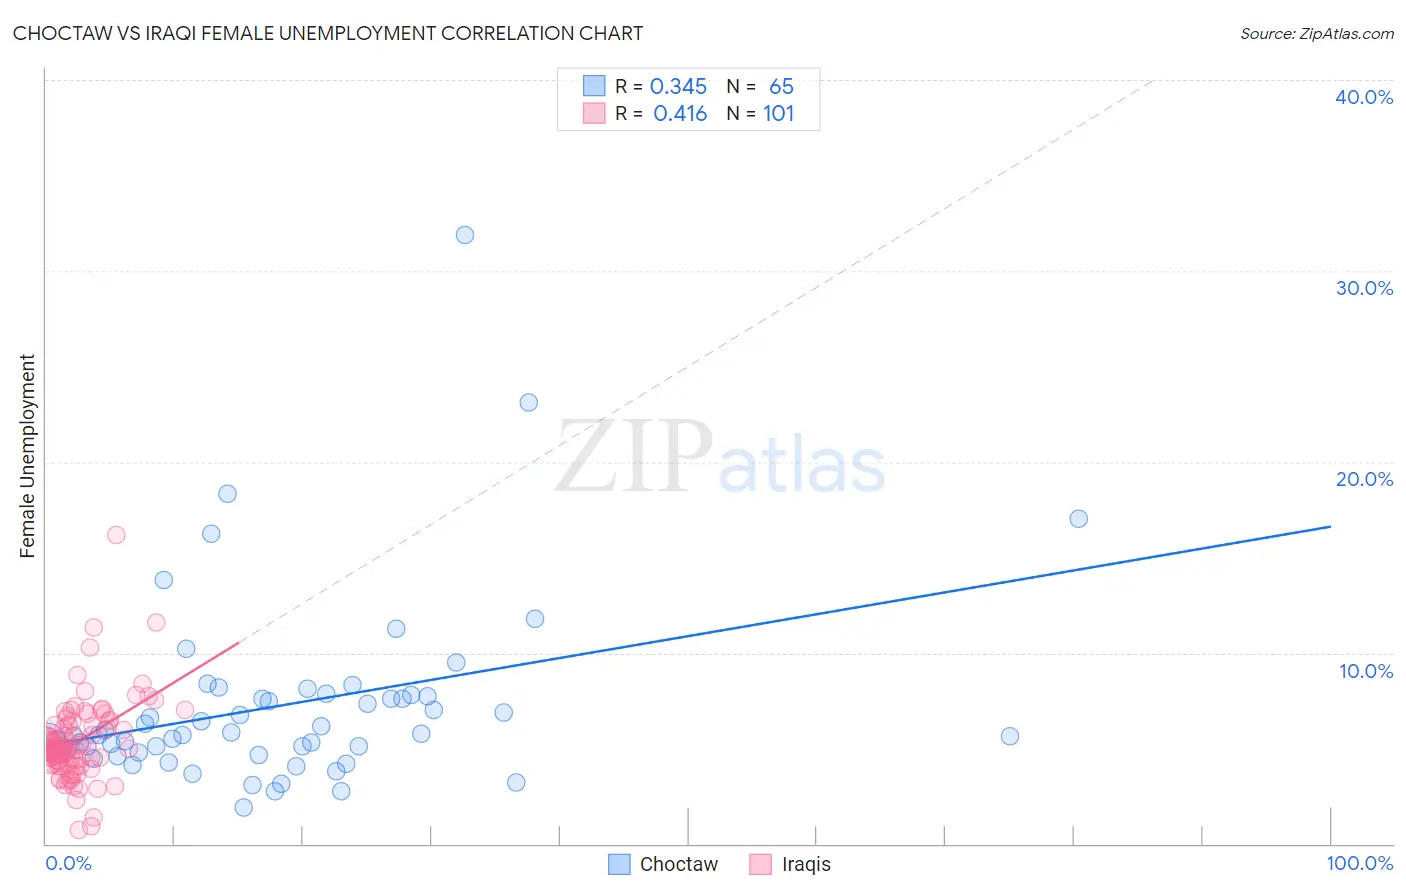
Choctaw vs Iraqi Female Unemployment Correlation Chart
The statistical analysis conducted on geographies consisting of 268,280,728 people shows a mild positive correlation between the proportion of Choctaw and unemploymnet rate among females in the United States with a correlation coefficient (R) of 0.345 and weighted average of 5.4%. Similarly, the statistical analysis conducted on geographies consisting of 170,530,535 people shows a moderate positive correlation between the proportion of Iraqis and unemploymnet rate among females in the United States with a correlation coefficient (R) of 0.416 and weighted average of 5.5%, a difference of 0.89%.
Female Unemployment Correlation Summary
| Measurement | Choctaw | Iraqi |
| Minimum | 1.9% | 0.70% |
| Maximum | 31.9% | 16.2% |
| Range | 30.0% | 15.5% |
| Mean | 7.2% | 5.3% |
| Median | 5.7% | 4.9% |
| Interquartile 25% (IQ1) | 4.9% | 4.3% |
| Interquartile 75% (IQ3) | 7.7% | 6.2% |
| Interquartile Range (IQR) | 2.9% | 1.9% |
| Standard Deviation (Sample) | 4.9% | 2.1% |
| Standard Deviation (Population) | 4.9% | 2.1% |
Demographics Similar to Choctaw and Iraqis by Female Unemployment
In terms of female unemployment, the demographic groups most similar to Choctaw are Ottawa (5.4%, a difference of 0.10%), Uruguayan (5.4%, a difference of 0.12%), Korean (5.4%, a difference of 0.15%), Immigrants from Costa Rica (5.4%, a difference of 0.19%), and Samoan (5.4%, a difference of 0.23%). Similarly, the demographic groups most similar to Iraqis are Delaware (5.5%, a difference of 0.030%), Nicaraguan (5.5%, a difference of 0.040%), Brazilian (5.5%, a difference of 0.060%), French American Indian (5.5%, a difference of 0.22%), and Immigrants from Peru (5.5%, a difference of 0.27%).
| Demographics | Rating | Rank | Female Unemployment |
| Creek | 15.4 /100 | #207 | Poor 5.4% |
| Immigrants | Costa Rica | 13.7 /100 | #208 | Poor 5.4% |
| Koreans | 13.4 /100 | #209 | Poor 5.4% |
| Choctaw | 12.3 /100 | #210 | Poor 5.4% |
| Ottawa | 11.6 /100 | #211 | Poor 5.4% |
| Uruguayans | 11.4 /100 | #212 | Poor 5.4% |
| Samoans | 10.6 /100 | #213 | Poor 5.4% |
| Seminole | 10.3 /100 | #214 | Poor 5.4% |
| Immigrants | Nicaragua | 10.2 /100 | #215 | Poor 5.4% |
| Comanche | 10.0 /100 | #216 | Poor 5.4% |
| Peruvians | 9.6 /100 | #217 | Tragic 5.4% |
| Bermudans | 9.0 /100 | #218 | Tragic 5.4% |
| South Americans | 8.6 /100 | #219 | Tragic 5.4% |
| Immigrants | Africa | 8.5 /100 | #220 | Tragic 5.4% |
| Brazilians | 7.3 /100 | #221 | Tragic 5.5% |
| Nicaraguans | 7.2 /100 | #222 | Tragic 5.5% |
| Delaware | 7.2 /100 | #223 | Tragic 5.5% |
| Iraqis | 7.1 /100 | #224 | Tragic 5.5% |
| French American Indians | 6.1 /100 | #225 | Tragic 5.5% |
| Immigrants | Peru | 5.9 /100 | #226 | Tragic 5.5% |
| Immigrants | Philippines | 5.3 /100 | #227 | Tragic 5.5% |