Choctaw vs U.S. Virgin Islander Female Unemployment
COMPARE
Choctaw
U.S. Virgin Islander
Female Unemployment
Female Unemployment Comparison
Choctaw
U.S. Virgin Islanders
5.4%
FEMALE UNEMPLOYMENT
12.3/ 100
METRIC RATING
210th/ 347
METRIC RANK
6.2%
FEMALE UNEMPLOYMENT
0.0/ 100
METRIC RATING
302nd/ 347
METRIC RANK
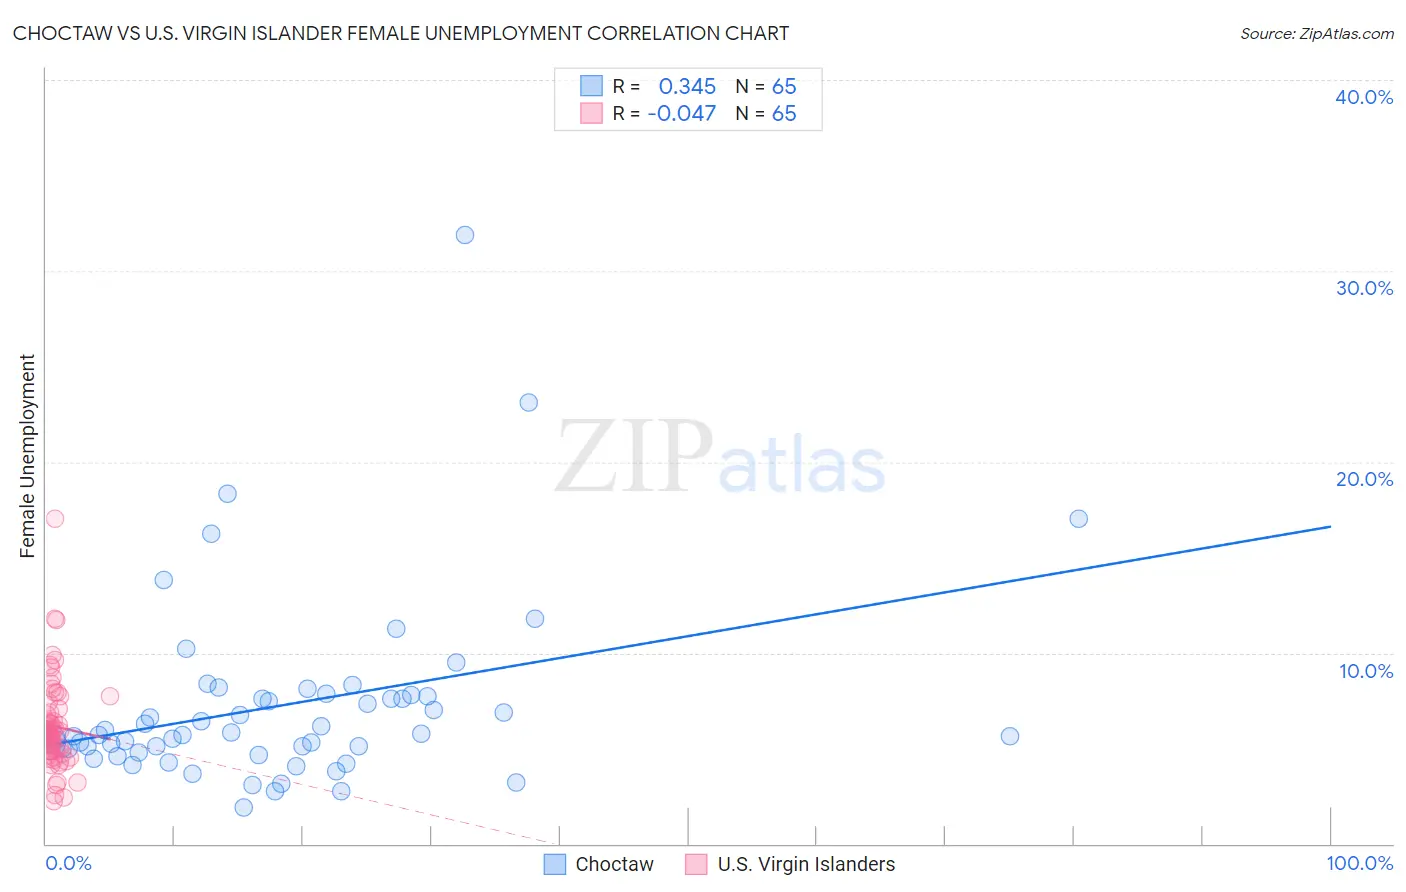
Choctaw vs U.S. Virgin Islander Female Unemployment Correlation Chart
The statistical analysis conducted on geographies consisting of 268,280,728 people shows a mild positive correlation between the proportion of Choctaw and unemploymnet rate among females in the United States with a correlation coefficient (R) of 0.345 and weighted average of 5.4%. Similarly, the statistical analysis conducted on geographies consisting of 87,490,240 people shows no correlation between the proportion of U.S. Virgin Islanders and unemploymnet rate among females in the United States with a correlation coefficient (R) of -0.047 and weighted average of 6.2%, a difference of 14.0%.
Female Unemployment Correlation Summary
| Measurement | Choctaw | U.S. Virgin Islander |
| Minimum | 1.9% | 2.2% |
| Maximum | 31.9% | 17.0% |
| Range | 30.0% | 14.8% |
| Mean | 7.2% | 6.2% |
| Median | 5.7% | 5.9% |
| Interquartile 25% (IQ1) | 4.9% | 4.8% |
| Interquartile 75% (IQ3) | 7.7% | 7.0% |
| Interquartile Range (IQR) | 2.9% | 2.2% |
| Standard Deviation (Sample) | 4.9% | 2.4% |
| Standard Deviation (Population) | 4.9% | 2.4% |
Similar Demographics by Female Unemployment
Demographics Similar to Choctaw by Female Unemployment
In terms of female unemployment, the demographic groups most similar to Choctaw are Ottawa (5.4%, a difference of 0.10%), Uruguayan (5.4%, a difference of 0.12%), Korean (5.4%, a difference of 0.15%), Immigrants from Costa Rica (5.4%, a difference of 0.19%), and Samoan (5.4%, a difference of 0.23%).
| Demographics | Rating | Rank | Female Unemployment |
| Immigrants | South Eastern Asia | 20.3 /100 | #203 | Fair 5.4% |
| Immigrants | Israel | 19.7 /100 | #204 | Poor 5.4% |
| Immigrants | Afghanistan | 18.9 /100 | #205 | Poor 5.4% |
| Immigrants | Brazil | 18.8 /100 | #206 | Poor 5.4% |
| Creek | 15.4 /100 | #207 | Poor 5.4% |
| Immigrants | Costa Rica | 13.7 /100 | #208 | Poor 5.4% |
| Koreans | 13.4 /100 | #209 | Poor 5.4% |
| Choctaw | 12.3 /100 | #210 | Poor 5.4% |
| Ottawa | 11.6 /100 | #211 | Poor 5.4% |
| Uruguayans | 11.4 /100 | #212 | Poor 5.4% |
| Samoans | 10.6 /100 | #213 | Poor 5.4% |
| Seminole | 10.3 /100 | #214 | Poor 5.4% |
| Immigrants | Nicaragua | 10.2 /100 | #215 | Poor 5.4% |
| Comanche | 10.0 /100 | #216 | Poor 5.4% |
| Peruvians | 9.6 /100 | #217 | Tragic 5.4% |
Demographics Similar to U.S. Virgin Islanders by Female Unemployment
In terms of female unemployment, the demographic groups most similar to U.S. Virgin Islanders are Immigrants from Barbados (6.2%, a difference of 0.15%), Barbadian (6.2%, a difference of 0.34%), Immigrants from Haiti (6.1%, a difference of 0.60%), Ute (6.1%, a difference of 0.65%), and Immigrants from Jamaica (6.2%, a difference of 0.71%).
| Demographics | Rating | Rank | Female Unemployment |
| Immigrants | Latin America | 0.0 /100 | #295 | Tragic 6.1% |
| Alaskan Athabascans | 0.0 /100 | #296 | Tragic 6.1% |
| West Indians | 0.0 /100 | #297 | Tragic 6.1% |
| Jamaicans | 0.0 /100 | #298 | Tragic 6.1% |
| Ute | 0.0 /100 | #299 | Tragic 6.1% |
| Immigrants | Haiti | 0.0 /100 | #300 | Tragic 6.1% |
| Immigrants | Barbados | 0.0 /100 | #301 | Tragic 6.2% |
| U.S. Virgin Islanders | 0.0 /100 | #302 | Tragic 6.2% |
| Barbadians | 0.0 /100 | #303 | Tragic 6.2% |
| Immigrants | Jamaica | 0.0 /100 | #304 | Tragic 6.2% |
| Spanish American Indians | 0.0 /100 | #305 | Tragic 6.2% |
| Immigrants | Central America | 0.0 /100 | #306 | Tragic 6.2% |
| Shoshone | 0.0 /100 | #307 | Tragic 6.2% |
| Hispanics or Latinos | 0.0 /100 | #308 | Tragic 6.2% |
| Ecuadorians | 0.0 /100 | #309 | Tragic 6.3% |