Slavic vs Apache Female Unemployment
COMPARE
Slavic
Apache
Female Unemployment
Female Unemployment Comparison
Slavs
Apache
4.9%
FEMALE UNEMPLOYMENT
99.1/ 100
METRIC RATING
52nd/ 347
METRIC RANK
6.6%
FEMALE UNEMPLOYMENT
0.0/ 100
METRIC RATING
325th/ 347
METRIC RANK
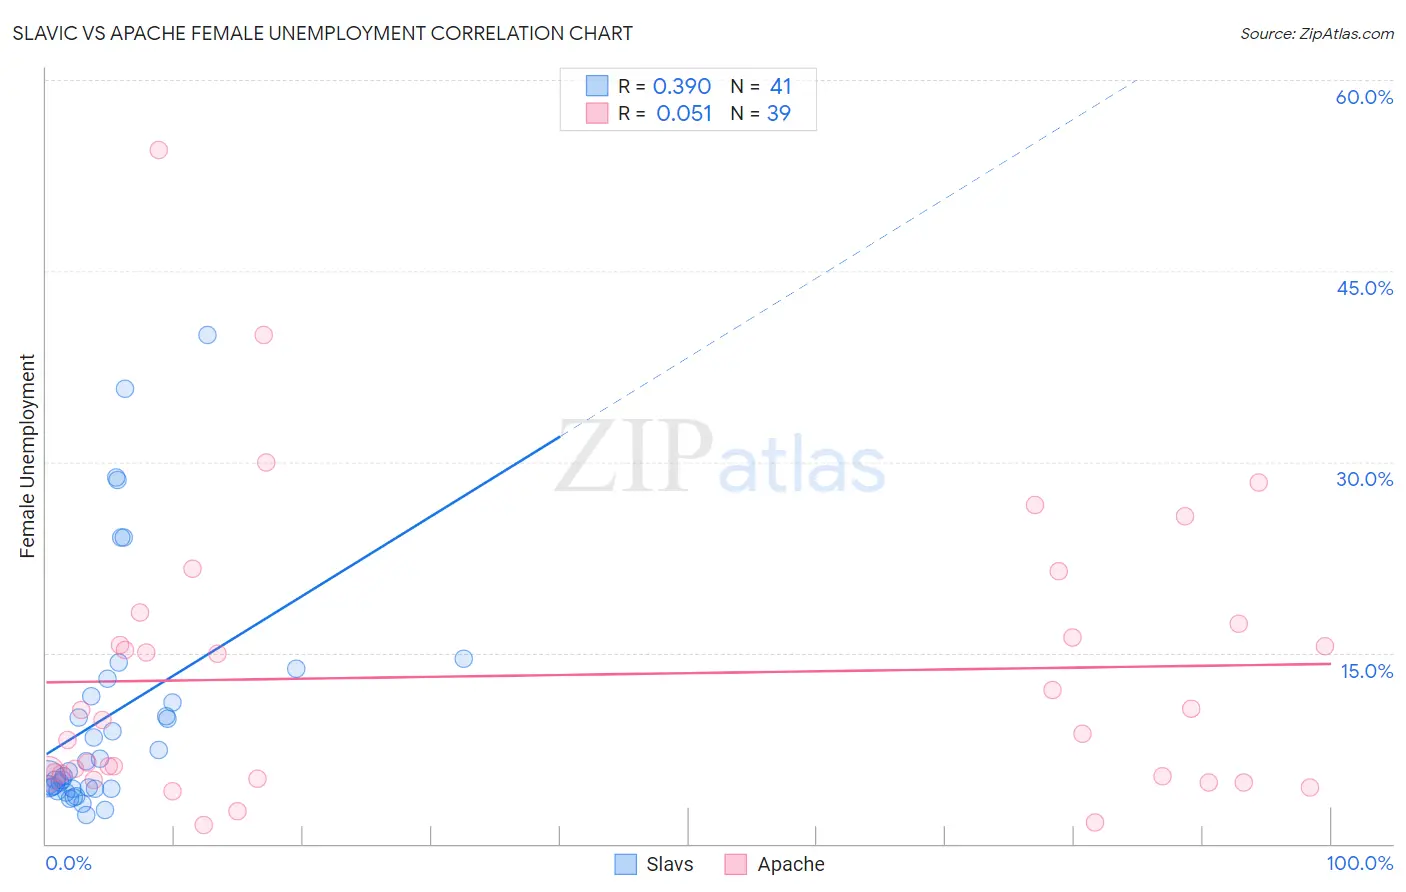
Slavic vs Apache Female Unemployment Correlation Chart
The statistical analysis conducted on geographies consisting of 269,881,664 people shows a mild positive correlation between the proportion of Slavs and unemploymnet rate among females in the United States with a correlation coefficient (R) of 0.390 and weighted average of 4.9%. Similarly, the statistical analysis conducted on geographies consisting of 230,279,610 people shows a slight positive correlation between the proportion of Apache and unemploymnet rate among females in the United States with a correlation coefficient (R) of 0.051 and weighted average of 6.6%, a difference of 34.8%.
Female Unemployment Correlation Summary
| Measurement | Slavic | Apache |
| Minimum | 2.3% | 1.5% |
| Maximum | 40.0% | 54.5% |
| Range | 37.7% | 53.0% |
| Mean | 10.1% | 13.2% |
| Median | 5.7% | 9.7% |
| Interquartile 25% (IQ1) | 4.3% | 5.3% |
| Interquartile 75% (IQ3) | 12.3% | 17.3% |
| Interquartile Range (IQR) | 7.9% | 12.0% |
| Standard Deviation (Sample) | 9.3% | 11.3% |
| Standard Deviation (Population) | 9.2% | 11.1% |
Similar Demographics by Female Unemployment
Demographics Similar to Slavs by Female Unemployment
In terms of female unemployment, the demographic groups most similar to Slavs are Cambodian (4.9%, a difference of 0.020%), White/Caucasian (4.9%, a difference of 0.030%), Immigrants from Cuba (4.9%, a difference of 0.040%), Immigrants from Zimbabwe (4.9%, a difference of 0.090%), and Immigrants from Moldova (4.9%, a difference of 0.10%).
| Demographics | Rating | Rank | Female Unemployment |
| Austrians | 99.3 /100 | #45 | Exceptional 4.9% |
| Immigrants | Bulgaria | 99.3 /100 | #46 | Exceptional 4.9% |
| Okinawans | 99.3 /100 | #47 | Exceptional 4.9% |
| Thais | 99.2 /100 | #48 | Exceptional 4.9% |
| Australians | 99.2 /100 | #49 | Exceptional 4.9% |
| Immigrants | Cuba | 99.1 /100 | #50 | Exceptional 4.9% |
| Cambodians | 99.1 /100 | #51 | Exceptional 4.9% |
| Slavs | 99.1 /100 | #52 | Exceptional 4.9% |
| Whites/Caucasians | 99.0 /100 | #53 | Exceptional 4.9% |
| Immigrants | Zimbabwe | 99.0 /100 | #54 | Exceptional 4.9% |
| Immigrants | Moldova | 99.0 /100 | #55 | Exceptional 4.9% |
| Serbians | 99.0 /100 | #56 | Exceptional 4.9% |
| Icelanders | 98.8 /100 | #57 | Exceptional 4.9% |
| Immigrants | Lithuania | 98.8 /100 | #58 | Exceptional 4.9% |
| Bhutanese | 98.7 /100 | #59 | Exceptional 4.9% |
Demographics Similar to Apache by Female Unemployment
In terms of female unemployment, the demographic groups most similar to Apache are Cheyenne (6.6%, a difference of 0.27%), Native/Alaskan (6.6%, a difference of 0.56%), Alaska Native (6.6%, a difference of 0.64%), Guyanese (6.7%, a difference of 1.1%), and Immigrants from Belize (6.5%, a difference of 1.3%).
| Demographics | Rating | Rank | Female Unemployment |
| British West Indians | 0.0 /100 | #318 | Tragic 6.4% |
| Immigrants | Bangladesh | 0.0 /100 | #319 | Tragic 6.5% |
| Immigrants | Dominica | 0.0 /100 | #320 | Tragic 6.5% |
| Blacks/African Americans | 0.0 /100 | #321 | Tragic 6.5% |
| Vietnamese | 0.0 /100 | #322 | Tragic 6.5% |
| Immigrants | Belize | 0.0 /100 | #323 | Tragic 6.5% |
| Cheyenne | 0.0 /100 | #324 | Tragic 6.6% |
| Apache | 0.0 /100 | #325 | Tragic 6.6% |
| Natives/Alaskans | 0.0 /100 | #326 | Tragic 6.6% |
| Alaska Natives | 0.0 /100 | #327 | Tragic 6.6% |
| Guyanese | 0.0 /100 | #328 | Tragic 6.7% |
| Immigrants | Guyana | 0.0 /100 | #329 | Tragic 6.7% |
| Yakama | 0.0 /100 | #330 | Tragic 6.7% |
| Paiute | 0.0 /100 | #331 | Tragic 6.8% |
| Sioux | 0.0 /100 | #332 | Tragic 7.0% |