Chippewa vs Immigrants from Italy Family Households
COMPARE
Chippewa
Immigrants from Italy
Family Households
Family Households Comparison
Chippewa
Immigrants from Italy
62.1%
FAMILY HOUSEHOLDS
0.0/ 100
METRIC RATING
308th/ 347
METRIC RANK
64.8%
FAMILY HOUSEHOLDS
90.2/ 100
METRIC RATING
130th/ 347
METRIC RANK
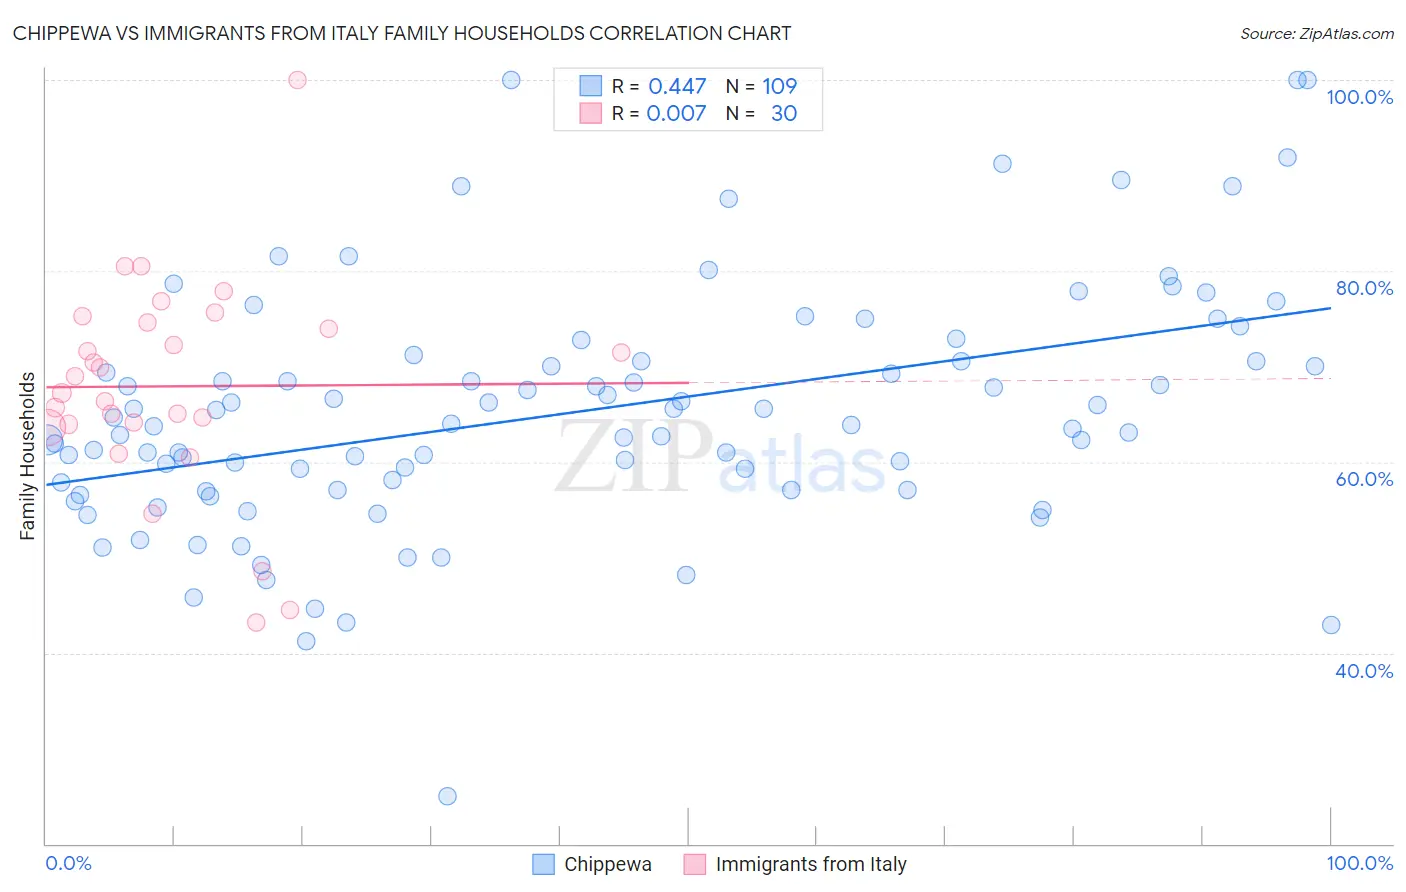
Chippewa vs Immigrants from Italy Family Households Correlation Chart
The statistical analysis conducted on geographies consisting of 215,001,181 people shows a moderate positive correlation between the proportion of Chippewa and percentage of family households in the United States with a correlation coefficient (R) of 0.447 and weighted average of 62.1%. Similarly, the statistical analysis conducted on geographies consisting of 324,146,705 people shows no correlation between the proportion of Immigrants from Italy and percentage of family households in the United States with a correlation coefficient (R) of 0.007 and weighted average of 64.8%, a difference of 4.3%.
Family Households Correlation Summary
| Measurement | Chippewa | Immigrants from Italy |
| Minimum | 25.0% | 43.1% |
| Maximum | 100.0% | 100.0% |
| Range | 75.0% | 56.9% |
| Mean | 65.2% | 67.9% |
| Median | 63.9% | 68.1% |
| Interquartile 25% (IQ1) | 57.0% | 63.9% |
| Interquartile 75% (IQ3) | 70.6% | 74.7% |
| Interquartile Range (IQR) | 13.5% | 10.7% |
| Standard Deviation (Sample) | 12.8% | 11.3% |
| Standard Deviation (Population) | 12.7% | 11.1% |
Similar Demographics by Family Households
Demographics Similar to Chippewa by Family Households
In terms of family households, the demographic groups most similar to Chippewa are Immigrants from Norway (62.1%, a difference of 0.0%), Subsaharan African (62.1%, a difference of 0.050%), African (62.1%, a difference of 0.080%), Bermudan (62.2%, a difference of 0.10%), and Immigrants from Liberia (62.0%, a difference of 0.10%).
| Demographics | Rating | Rank | Family Households |
| Immigrants | Albania | 0.0 /100 | #301 | Tragic 62.4% |
| Immigrants | Kenya | 0.0 /100 | #302 | Tragic 62.3% |
| Cree | 0.0 /100 | #303 | Tragic 62.3% |
| Iroquois | 0.0 /100 | #304 | Tragic 62.2% |
| Bermudans | 0.0 /100 | #305 | Tragic 62.2% |
| Africans | 0.0 /100 | #306 | Tragic 62.1% |
| Immigrants | Norway | 0.0 /100 | #307 | Tragic 62.1% |
| Chippewa | 0.0 /100 | #308 | Tragic 62.1% |
| Sub-Saharan Africans | 0.0 /100 | #309 | Tragic 62.1% |
| Immigrants | Liberia | 0.0 /100 | #310 | Tragic 62.0% |
| Immigrants | Morocco | 0.0 /100 | #311 | Tragic 62.0% |
| Immigrants | Latvia | 0.0 /100 | #312 | Tragic 62.0% |
| Liberians | 0.0 /100 | #313 | Tragic 62.0% |
| Immigrants | Cabo Verde | 0.0 /100 | #314 | Tragic 61.9% |
| Moroccans | 0.0 /100 | #315 | Tragic 61.9% |
Demographics Similar to Immigrants from Italy by Family Households
In terms of family households, the demographic groups most similar to Immigrants from Italy are Nonimmigrants (64.8%, a difference of 0.010%), Cajun (64.8%, a difference of 0.030%), Belizean (64.8%, a difference of 0.040%), Immigrants from Ecuador (64.8%, a difference of 0.050%), and Immigrants from Panama (64.8%, a difference of 0.070%).
| Demographics | Rating | Rank | Family Households |
| Choctaw | 93.4 /100 | #123 | Exceptional 64.9% |
| Immigrants | Argentina | 92.8 /100 | #124 | Exceptional 64.9% |
| Immigrants | Belize | 92.7 /100 | #125 | Exceptional 64.9% |
| Panamanians | 92.4 /100 | #126 | Exceptional 64.8% |
| Immigrants | Panama | 92.0 /100 | #127 | Exceptional 64.8% |
| Italians | 91.9 /100 | #128 | Exceptional 64.8% |
| Immigrants | Ecuador | 91.4 /100 | #129 | Exceptional 64.8% |
| Immigrants | Italy | 90.2 /100 | #130 | Exceptional 64.8% |
| Immigrants | Nonimmigrants | 90.1 /100 | #131 | Exceptional 64.8% |
| Cajuns | 89.4 /100 | #132 | Excellent 64.8% |
| Belizeans | 89.3 /100 | #133 | Excellent 64.8% |
| Greeks | 88.1 /100 | #134 | Excellent 64.7% |
| Maltese | 87.4 /100 | #135 | Excellent 64.7% |
| Immigrants | China | 86.6 /100 | #136 | Excellent 64.7% |
| Immigrants | Scotland | 86.4 /100 | #137 | Excellent 64.7% |