Czech vs Immigrants from Italy Female Unemployment
COMPARE
Czech
Immigrants from Italy
Female Unemployment
Female Unemployment Comparison
Czechs
Immigrants from Italy
4.4%
FEMALE UNEMPLOYMENT
100.0/ 100
METRIC RATING
2nd/ 347
METRIC RANK
5.2%
FEMALE UNEMPLOYMENT
75.0/ 100
METRIC RATING
152nd/ 347
METRIC RANK
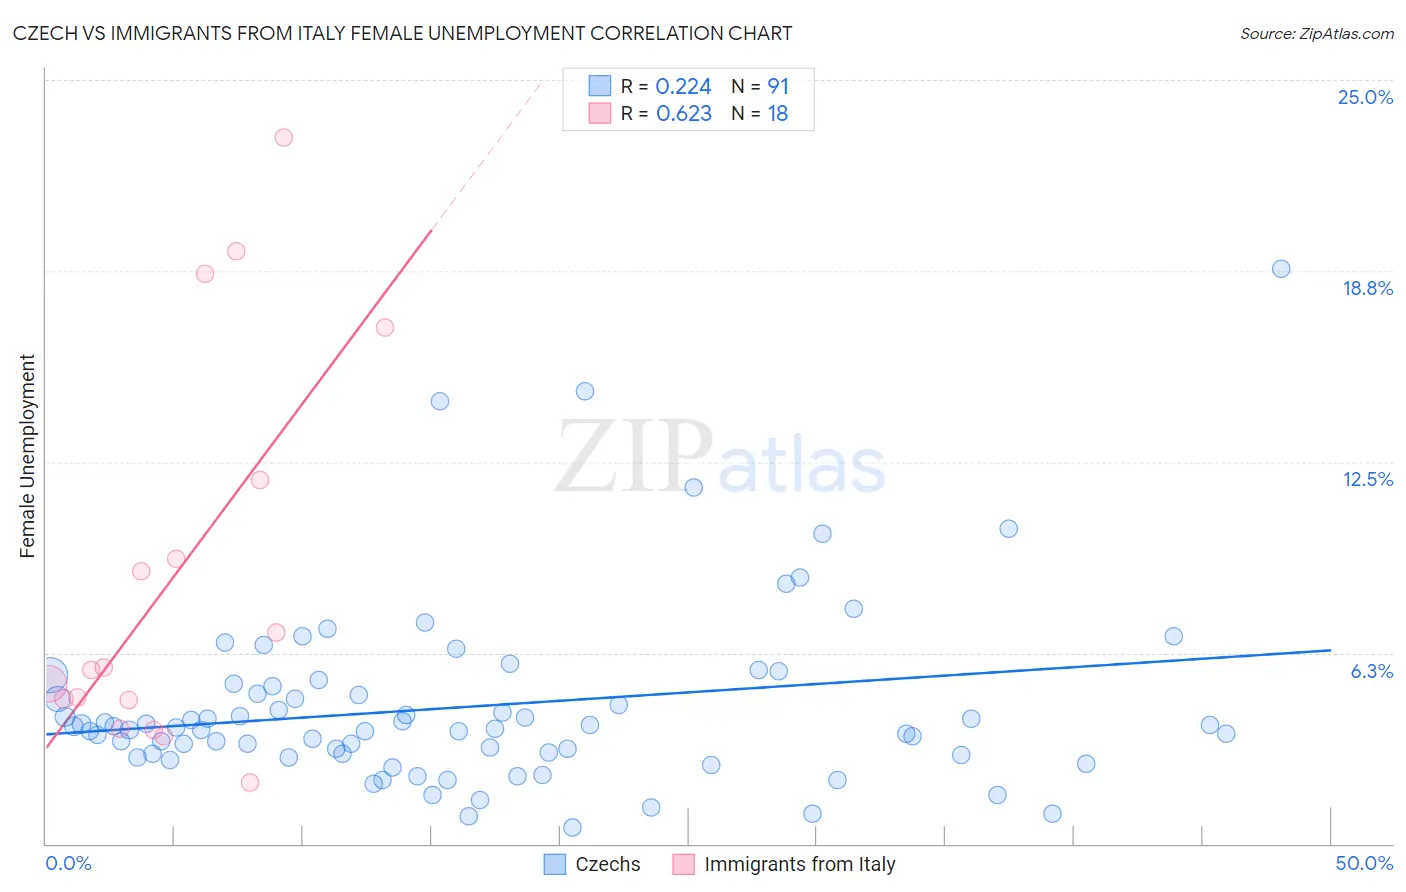
Czech vs Immigrants from Italy Female Unemployment Correlation Chart
The statistical analysis conducted on geographies consisting of 478,075,637 people shows a weak positive correlation between the proportion of Czechs and unemploymnet rate among females in the United States with a correlation coefficient (R) of 0.224 and weighted average of 4.4%. Similarly, the statistical analysis conducted on geographies consisting of 323,110,337 people shows a significant positive correlation between the proportion of Immigrants from Italy and unemploymnet rate among females in the United States with a correlation coefficient (R) of 0.623 and weighted average of 5.2%, a difference of 17.8%.
Female Unemployment Correlation Summary
| Measurement | Czech | Immigrants from Italy |
| Minimum | 0.54% | 2.0% |
| Maximum | 18.8% | 23.1% |
| Range | 18.3% | 21.1% |
| Mean | 4.5% | 8.8% |
| Median | 3.8% | 5.7% |
| Interquartile 25% (IQ1) | 3.0% | 4.7% |
| Interquartile 75% (IQ3) | 5.1% | 11.9% |
| Interquartile Range (IQR) | 2.2% | 7.2% |
| Standard Deviation (Sample) | 3.0% | 6.4% |
| Standard Deviation (Population) | 3.0% | 6.2% |
Similar Demographics by Female Unemployment
Demographics Similar to Czechs by Female Unemployment
In terms of female unemployment, the demographic groups most similar to Czechs are Luxembourger (4.4%, a difference of 0.010%), Danish (4.4%, a difference of 0.040%), Hmong (4.4%, a difference of 0.15%), Swedish (4.4%, a difference of 1.4%), and Chinese (4.5%, a difference of 2.2%).
| Demographics | Rating | Rank | Female Unemployment |
| Norwegians | 100.0 /100 | #1 | Exceptional 4.2% |
| Czechs | 100.0 /100 | #2 | Exceptional 4.4% |
| Luxembourgers | 100.0 /100 | #3 | Exceptional 4.4% |
| Danes | 100.0 /100 | #4 | Exceptional 4.4% |
| Hmong | 100.0 /100 | #5 | Exceptional 4.4% |
| Swedes | 100.0 /100 | #6 | Exceptional 4.4% |
| Chinese | 100.0 /100 | #7 | Exceptional 4.5% |
| Germans | 100.0 /100 | #8 | Exceptional 4.5% |
| Slovenes | 100.0 /100 | #9 | Exceptional 4.5% |
| Swiss | 100.0 /100 | #10 | Exceptional 4.6% |
| Scandinavians | 100.0 /100 | #11 | Exceptional 4.6% |
| Dutch | 100.0 /100 | #12 | Exceptional 4.6% |
| Belgians | 100.0 /100 | #13 | Exceptional 4.6% |
| Finns | 100.0 /100 | #14 | Exceptional 4.6% |
| English | 100.0 /100 | #15 | Exceptional 4.6% |
Demographics Similar to Immigrants from Italy by Female Unemployment
In terms of female unemployment, the demographic groups most similar to Immigrants from Italy are Immigrants from Greece (5.2%, a difference of 0.010%), Immigrants from China (5.2%, a difference of 0.080%), Egyptian (5.2%, a difference of 0.28%), Asian (5.2%, a difference of 0.29%), and Immigrants from Argentina (5.2%, a difference of 0.32%).
| Demographics | Rating | Rank | Female Unemployment |
| Immigrants | Oceania | 79.5 /100 | #145 | Good 5.2% |
| Immigrants | Norway | 79.4 /100 | #146 | Good 5.2% |
| Argentineans | 79.2 /100 | #147 | Good 5.2% |
| Immigrants | Argentina | 78.7 /100 | #148 | Good 5.2% |
| Asians | 78.3 /100 | #149 | Good 5.2% |
| Egyptians | 78.3 /100 | #150 | Good 5.2% |
| Immigrants | China | 75.9 /100 | #151 | Good 5.2% |
| Immigrants | Italy | 75.0 /100 | #152 | Good 5.2% |
| Immigrants | Greece | 74.9 /100 | #153 | Good 5.2% |
| South Africans | 70.8 /100 | #154 | Good 5.2% |
| Immigrants | Egypt | 70.0 /100 | #155 | Good 5.2% |
| Immigrants | Northern Africa | 69.6 /100 | #156 | Good 5.2% |
| Immigrants | Russia | 69.3 /100 | #157 | Good 5.2% |
| Albanians | 68.3 /100 | #158 | Good 5.2% |
| Immigrants | Micronesia | 66.9 /100 | #159 | Good 5.2% |