Moroccan vs Immigrants from Italy Female Unemployment
COMPARE
Moroccan
Immigrants from Italy
Female Unemployment
Female Unemployment Comparison
Moroccans
Immigrants from Italy
5.5%
FEMALE UNEMPLOYMENT
3.4/ 100
METRIC RATING
233rd/ 347
METRIC RANK
5.2%
FEMALE UNEMPLOYMENT
75.0/ 100
METRIC RATING
152nd/ 347
METRIC RANK
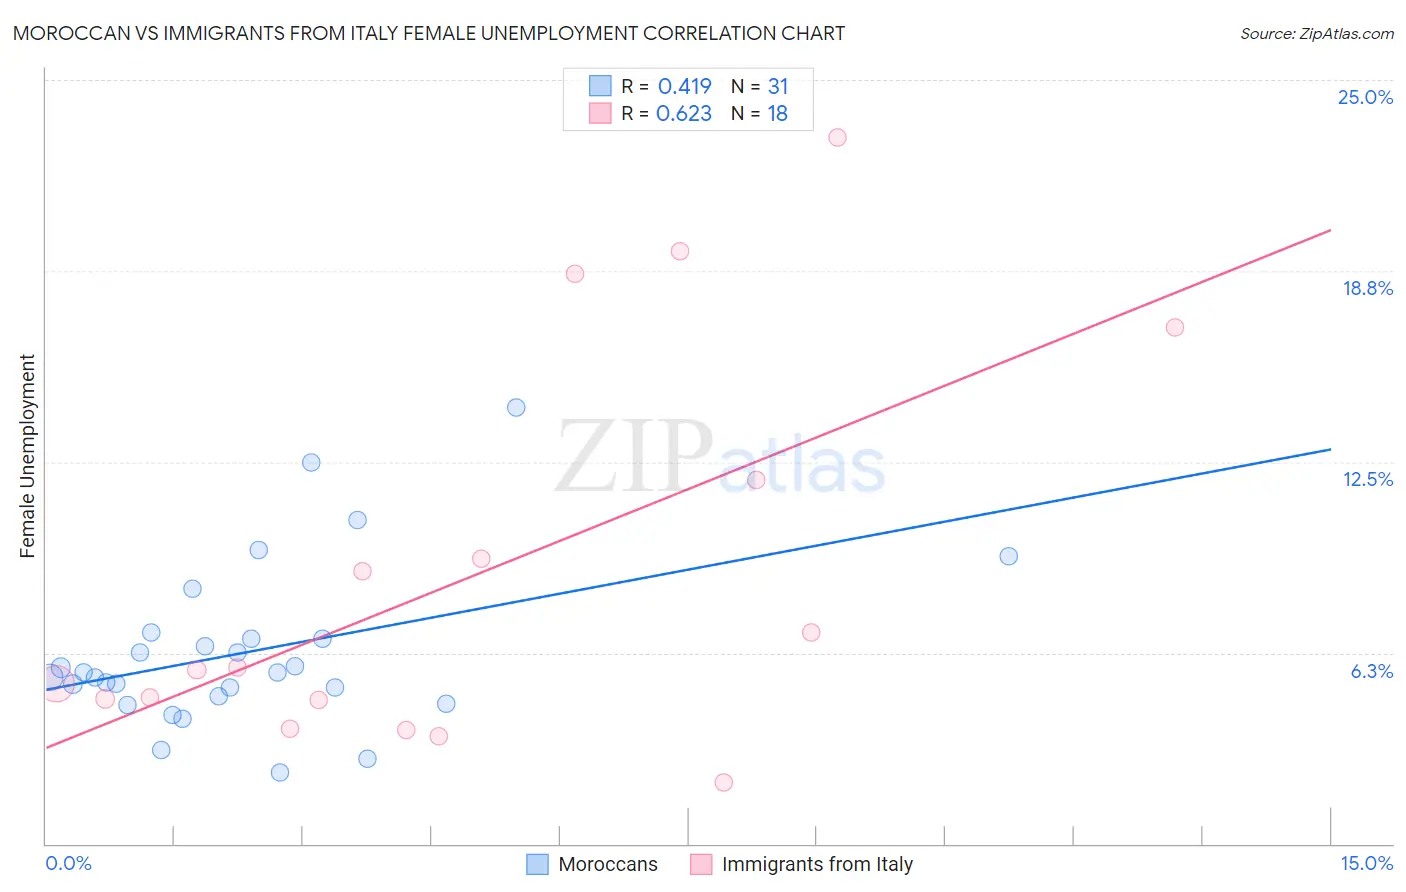
Moroccan vs Immigrants from Italy Female Unemployment Correlation Chart
The statistical analysis conducted on geographies consisting of 201,565,511 people shows a moderate positive correlation between the proportion of Moroccans and unemploymnet rate among females in the United States with a correlation coefficient (R) of 0.419 and weighted average of 5.5%. Similarly, the statistical analysis conducted on geographies consisting of 323,110,337 people shows a significant positive correlation between the proportion of Immigrants from Italy and unemploymnet rate among females in the United States with a correlation coefficient (R) of 0.623 and weighted average of 5.2%, a difference of 6.8%.
Female Unemployment Correlation Summary
| Measurement | Moroccan | Immigrants from Italy |
| Minimum | 2.3% | 2.0% |
| Maximum | 14.3% | 23.1% |
| Range | 11.9% | 21.1% |
| Mean | 6.3% | 8.8% |
| Median | 5.6% | 5.7% |
| Interquartile 25% (IQ1) | 4.8% | 4.7% |
| Interquartile 75% (IQ3) | 6.7% | 11.9% |
| Interquartile Range (IQR) | 1.9% | 7.2% |
| Standard Deviation (Sample) | 2.7% | 6.4% |
| Standard Deviation (Population) | 2.6% | 6.2% |
Similar Demographics by Female Unemployment
Demographics Similar to Moroccans by Female Unemployment
In terms of female unemployment, the demographic groups most similar to Moroccans are Immigrants from Lebanon (5.5%, a difference of 0.020%), Immigrants from Iran (5.5%, a difference of 0.030%), Immigrants from Cambodia (5.5%, a difference of 0.060%), Immigrants from Panama (5.5%, a difference of 0.080%), and Sierra Leonean (5.5%, a difference of 0.10%).
| Demographics | Rating | Rank | Female Unemployment |
| Immigrants | Peru | 5.9 /100 | #226 | Tragic 5.5% |
| Immigrants | Philippines | 5.3 /100 | #227 | Tragic 5.5% |
| Israelis | 4.8 /100 | #228 | Tragic 5.5% |
| Panamanians | 4.7 /100 | #229 | Tragic 5.5% |
| Immigrants | Uruguay | 4.7 /100 | #230 | Tragic 5.5% |
| Immigrants | Iraq | 3.9 /100 | #231 | Tragic 5.5% |
| Liberians | 3.9 /100 | #232 | Tragic 5.5% |
| Moroccans | 3.4 /100 | #233 | Tragic 5.5% |
| Immigrants | Lebanon | 3.3 /100 | #234 | Tragic 5.5% |
| Immigrants | Iran | 3.3 /100 | #235 | Tragic 5.5% |
| Immigrants | Cambodia | 3.3 /100 | #236 | Tragic 5.5% |
| Immigrants | Panama | 3.2 /100 | #237 | Tragic 5.5% |
| Sierra Leoneans | 3.2 /100 | #238 | Tragic 5.5% |
| Aleuts | 3.0 /100 | #239 | Tragic 5.5% |
| Immigrants | South America | 2.9 /100 | #240 | Tragic 5.5% |
Demographics Similar to Immigrants from Italy by Female Unemployment
In terms of female unemployment, the demographic groups most similar to Immigrants from Italy are Immigrants from Greece (5.2%, a difference of 0.010%), Immigrants from China (5.2%, a difference of 0.080%), Egyptian (5.2%, a difference of 0.28%), Asian (5.2%, a difference of 0.29%), and Immigrants from Argentina (5.2%, a difference of 0.32%).
| Demographics | Rating | Rank | Female Unemployment |
| Immigrants | Oceania | 79.5 /100 | #145 | Good 5.2% |
| Immigrants | Norway | 79.4 /100 | #146 | Good 5.2% |
| Argentineans | 79.2 /100 | #147 | Good 5.2% |
| Immigrants | Argentina | 78.7 /100 | #148 | Good 5.2% |
| Asians | 78.3 /100 | #149 | Good 5.2% |
| Egyptians | 78.3 /100 | #150 | Good 5.2% |
| Immigrants | China | 75.9 /100 | #151 | Good 5.2% |
| Immigrants | Italy | 75.0 /100 | #152 | Good 5.2% |
| Immigrants | Greece | 74.9 /100 | #153 | Good 5.2% |
| South Africans | 70.8 /100 | #154 | Good 5.2% |
| Immigrants | Egypt | 70.0 /100 | #155 | Good 5.2% |
| Immigrants | Northern Africa | 69.6 /100 | #156 | Good 5.2% |
| Immigrants | Russia | 69.3 /100 | #157 | Good 5.2% |
| Albanians | 68.3 /100 | #158 | Good 5.2% |
| Immigrants | Micronesia | 66.9 /100 | #159 | Good 5.2% |