Cherokee vs Immigrants from Malaysia Male Unemployment
COMPARE
Cherokee
Immigrants from Malaysia
Male Unemployment
Male Unemployment Comparison
Cherokee
Immigrants from Malaysia
5.6%
MALE UNEMPLOYMENT
2.4/ 100
METRIC RATING
224th/ 347
METRIC RANK
5.2%
MALE UNEMPLOYMENT
83.5/ 100
METRIC RATING
130th/ 347
METRIC RANK
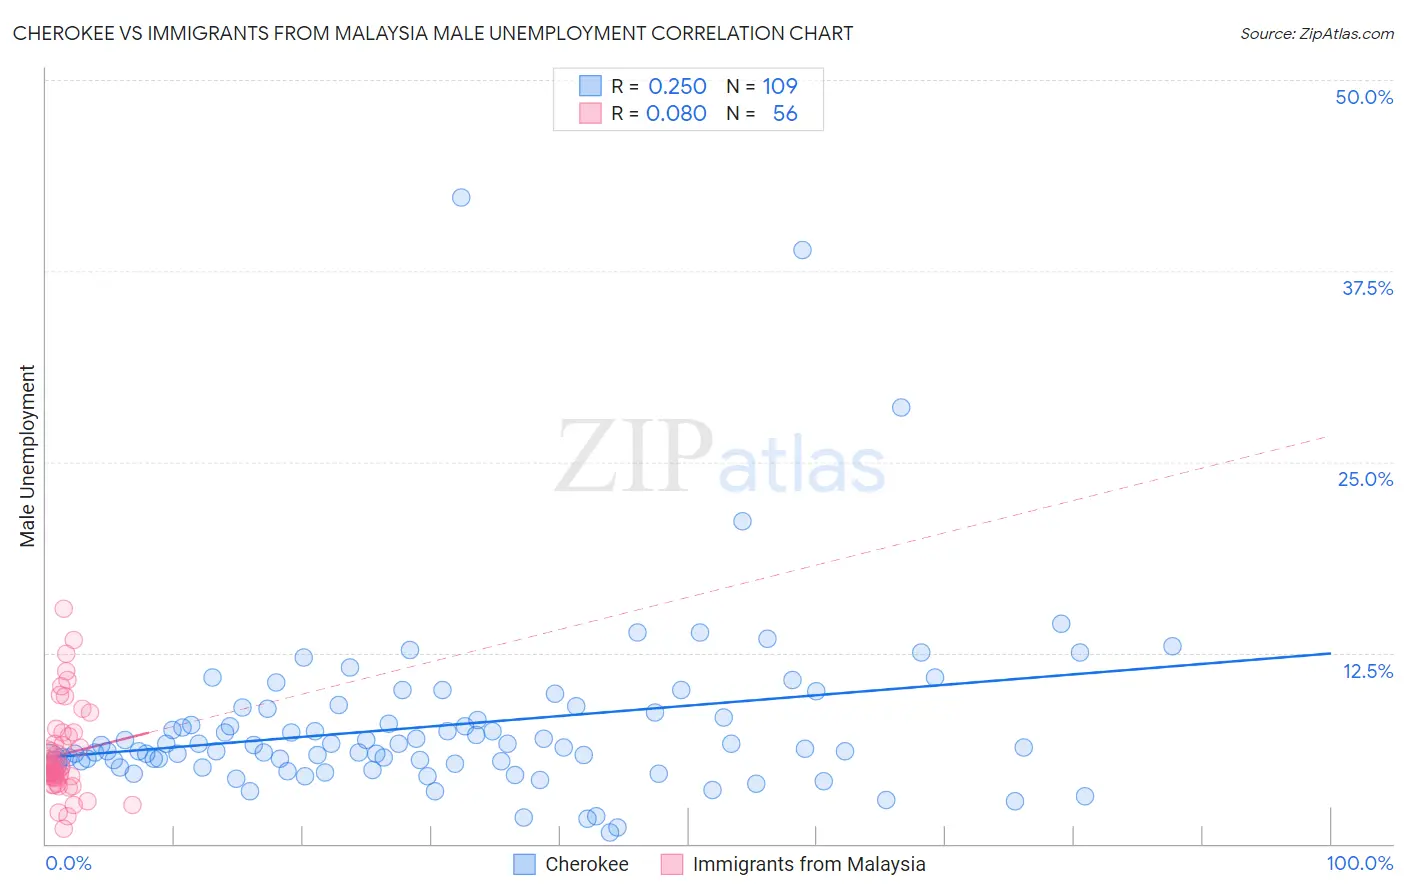
Cherokee vs Immigrants from Malaysia Male Unemployment Correlation Chart
The statistical analysis conducted on geographies consisting of 488,550,213 people shows a weak positive correlation between the proportion of Cherokee and unemployment rate among males in the United States with a correlation coefficient (R) of 0.250 and weighted average of 5.6%. Similarly, the statistical analysis conducted on geographies consisting of 197,762,289 people shows a slight positive correlation between the proportion of Immigrants from Malaysia and unemployment rate among males in the United States with a correlation coefficient (R) of 0.080 and weighted average of 5.2%, a difference of 8.0%.
Male Unemployment Correlation Summary
| Measurement | Cherokee | Immigrants from Malaysia |
| Minimum | 0.70% | 1.0% |
| Maximum | 42.3% | 15.4% |
| Range | 41.6% | 14.4% |
| Mean | 7.8% | 5.8% |
| Median | 6.3% | 5.0% |
| Interquartile 25% (IQ1) | 5.3% | 4.4% |
| Interquartile 75% (IQ3) | 8.7% | 6.8% |
| Interquartile Range (IQR) | 3.4% | 2.4% |
| Standard Deviation (Sample) | 5.9% | 2.9% |
| Standard Deviation (Population) | 5.9% | 2.9% |
Similar Demographics by Male Unemployment
Demographics Similar to Cherokee by Male Unemployment
In terms of male unemployment, the demographic groups most similar to Cherokee are Creek (5.6%, a difference of 0.13%), Immigrants from Micronesia (5.6%, a difference of 0.28%), Panamanian (5.6%, a difference of 0.32%), Immigrants from Cambodia (5.6%, a difference of 0.41%), and Immigrants from Panama (5.6%, a difference of 0.41%).
| Demographics | Rating | Rank | Male Unemployment |
| Delaware | 4.2 /100 | #217 | Tragic 5.5% |
| Immigrants | Albania | 3.6 /100 | #218 | Tragic 5.5% |
| Immigrants | Western Asia | 3.5 /100 | #219 | Tragic 5.6% |
| Portuguese | 3.5 /100 | #220 | Tragic 5.6% |
| Soviet Union | 3.2 /100 | #221 | Tragic 5.6% |
| Immigrants | Micronesia | 2.9 /100 | #222 | Tragic 5.6% |
| Creek | 2.6 /100 | #223 | Tragic 5.6% |
| Cherokee | 2.4 /100 | #224 | Tragic 5.6% |
| Panamanians | 1.9 /100 | #225 | Tragic 5.6% |
| Immigrants | Cambodia | 1.8 /100 | #226 | Tragic 5.6% |
| Immigrants | Panama | 1.8 /100 | #227 | Tragic 5.6% |
| Seminole | 1.8 /100 | #228 | Tragic 5.6% |
| Central Americans | 1.8 /100 | #229 | Tragic 5.6% |
| Immigrants | Africa | 1.7 /100 | #230 | Tragic 5.6% |
| Choctaw | 1.6 /100 | #231 | Tragic 5.6% |
Demographics Similar to Immigrants from Malaysia by Male Unemployment
In terms of male unemployment, the demographic groups most similar to Immigrants from Malaysia are Immigrants from Germany (5.2%, a difference of 0.050%), Chickasaw (5.2%, a difference of 0.070%), Immigrants from Western Europe (5.2%, a difference of 0.15%), Hungarian (5.2%, a difference of 0.18%), and Colombian (5.2%, a difference of 0.25%).
| Demographics | Rating | Rank | Male Unemployment |
| Palestinians | 87.7 /100 | #123 | Excellent 5.1% |
| Immigrants | Latvia | 87.5 /100 | #124 | Excellent 5.1% |
| Immigrants | Lithuania | 87.2 /100 | #125 | Excellent 5.1% |
| Immigrants | Colombia | 86.8 /100 | #126 | Excellent 5.1% |
| Immigrants | Brazil | 86.3 /100 | #127 | Excellent 5.2% |
| Hungarians | 85.1 /100 | #128 | Excellent 5.2% |
| Immigrants | Western Europe | 84.8 /100 | #129 | Excellent 5.2% |
| Immigrants | Malaysia | 83.5 /100 | #130 | Excellent 5.2% |
| Immigrants | Germany | 83.0 /100 | #131 | Excellent 5.2% |
| Chickasaw | 82.9 /100 | #132 | Excellent 5.2% |
| Colombians | 81.1 /100 | #133 | Excellent 5.2% |
| Pakistanis | 80.5 /100 | #134 | Excellent 5.2% |
| Immigrants | Saudi Arabia | 80.1 /100 | #135 | Excellent 5.2% |
| Lebanese | 79.9 /100 | #136 | Good 5.2% |
| Immigrants | Eastern Africa | 79.8 /100 | #137 | Good 5.2% |