Cherokee vs Immigrants from Haiti Male Unemployment
COMPARE
Cherokee
Immigrants from Haiti
Male Unemployment
Male Unemployment Comparison
Cherokee
Immigrants from Haiti
5.6%
MALE UNEMPLOYMENT
2.4/ 100
METRIC RATING
224th/ 347
METRIC RANK
6.5%
MALE UNEMPLOYMENT
0.0/ 100
METRIC RATING
296th/ 347
METRIC RANK
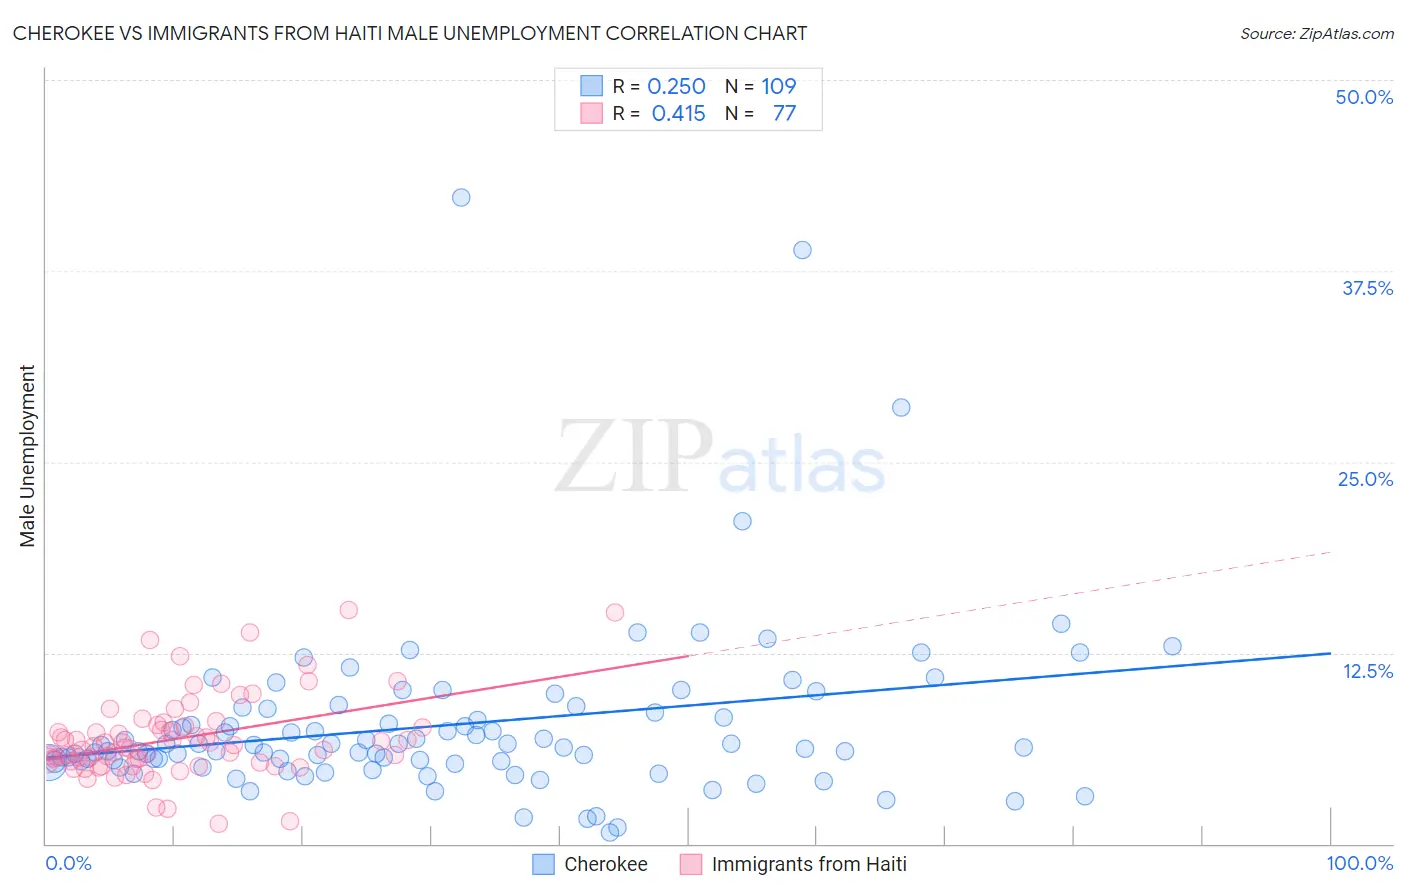
Cherokee vs Immigrants from Haiti Male Unemployment Correlation Chart
The statistical analysis conducted on geographies consisting of 488,550,213 people shows a weak positive correlation between the proportion of Cherokee and unemployment rate among males in the United States with a correlation coefficient (R) of 0.250 and weighted average of 5.6%. Similarly, the statistical analysis conducted on geographies consisting of 224,769,713 people shows a moderate positive correlation between the proportion of Immigrants from Haiti and unemployment rate among males in the United States with a correlation coefficient (R) of 0.415 and weighted average of 6.5%, a difference of 17.0%.
Male Unemployment Correlation Summary
| Measurement | Cherokee | Immigrants from Haiti |
| Minimum | 0.70% | 1.3% |
| Maximum | 42.3% | 15.3% |
| Range | 41.6% | 14.0% |
| Mean | 7.8% | 6.9% |
| Median | 6.3% | 6.3% |
| Interquartile 25% (IQ1) | 5.3% | 5.3% |
| Interquartile 75% (IQ3) | 8.7% | 7.7% |
| Interquartile Range (IQR) | 3.4% | 2.4% |
| Standard Deviation (Sample) | 5.9% | 2.7% |
| Standard Deviation (Population) | 5.9% | 2.7% |
Similar Demographics by Male Unemployment
Demographics Similar to Cherokee by Male Unemployment
In terms of male unemployment, the demographic groups most similar to Cherokee are Creek (5.6%, a difference of 0.13%), Immigrants from Micronesia (5.6%, a difference of 0.28%), Panamanian (5.6%, a difference of 0.32%), Immigrants from Cambodia (5.6%, a difference of 0.41%), and Immigrants from Panama (5.6%, a difference of 0.41%).
| Demographics | Rating | Rank | Male Unemployment |
| Delaware | 4.2 /100 | #217 | Tragic 5.5% |
| Immigrants | Albania | 3.6 /100 | #218 | Tragic 5.5% |
| Immigrants | Western Asia | 3.5 /100 | #219 | Tragic 5.6% |
| Portuguese | 3.5 /100 | #220 | Tragic 5.6% |
| Soviet Union | 3.2 /100 | #221 | Tragic 5.6% |
| Immigrants | Micronesia | 2.9 /100 | #222 | Tragic 5.6% |
| Creek | 2.6 /100 | #223 | Tragic 5.6% |
| Cherokee | 2.4 /100 | #224 | Tragic 5.6% |
| Panamanians | 1.9 /100 | #225 | Tragic 5.6% |
| Immigrants | Cambodia | 1.8 /100 | #226 | Tragic 5.6% |
| Immigrants | Panama | 1.8 /100 | #227 | Tragic 5.6% |
| Seminole | 1.8 /100 | #228 | Tragic 5.6% |
| Central Americans | 1.8 /100 | #229 | Tragic 5.6% |
| Immigrants | Africa | 1.7 /100 | #230 | Tragic 5.6% |
| Choctaw | 1.6 /100 | #231 | Tragic 5.6% |
Demographics Similar to Immigrants from Haiti by Male Unemployment
In terms of male unemployment, the demographic groups most similar to Immigrants from Haiti are Chippewa (6.6%, a difference of 0.32%), Jamaican (6.6%, a difference of 0.40%), Belizean (6.5%, a difference of 0.45%), Immigrants from Bangladesh (6.6%, a difference of 0.53%), and Vietnamese (6.6%, a difference of 0.80%).
| Demographics | Rating | Rank | Male Unemployment |
| Immigrants | Caribbean | 0.0 /100 | #289 | Tragic 6.3% |
| U.S. Virgin Islanders | 0.0 /100 | #290 | Tragic 6.4% |
| Immigrants | Azores | 0.0 /100 | #291 | Tragic 6.4% |
| Nepalese | 0.0 /100 | #292 | Tragic 6.4% |
| Haitians | 0.0 /100 | #293 | Tragic 6.4% |
| Senegalese | 0.0 /100 | #294 | Tragic 6.4% |
| Belizeans | 0.0 /100 | #295 | Tragic 6.5% |
| Immigrants | Haiti | 0.0 /100 | #296 | Tragic 6.5% |
| Chippewa | 0.0 /100 | #297 | Tragic 6.6% |
| Jamaicans | 0.0 /100 | #298 | Tragic 6.6% |
| Immigrants | Bangladesh | 0.0 /100 | #299 | Tragic 6.6% |
| Vietnamese | 0.0 /100 | #300 | Tragic 6.6% |
| Immigrants | Belize | 0.0 /100 | #301 | Tragic 6.6% |
| Ute | 0.0 /100 | #302 | Tragic 6.6% |
| Immigrants | West Indies | 0.0 /100 | #303 | Tragic 6.7% |