Cherokee vs Yakama Male Unemployment
COMPARE
Cherokee
Yakama
Male Unemployment
Male Unemployment Comparison
Cherokee
Yakama
5.6%
MALE UNEMPLOYMENT
2.4/ 100
METRIC RATING
224th/ 347
METRIC RANK
7.9%
MALE UNEMPLOYMENT
0.0/ 100
METRIC RATING
330th/ 347
METRIC RANK
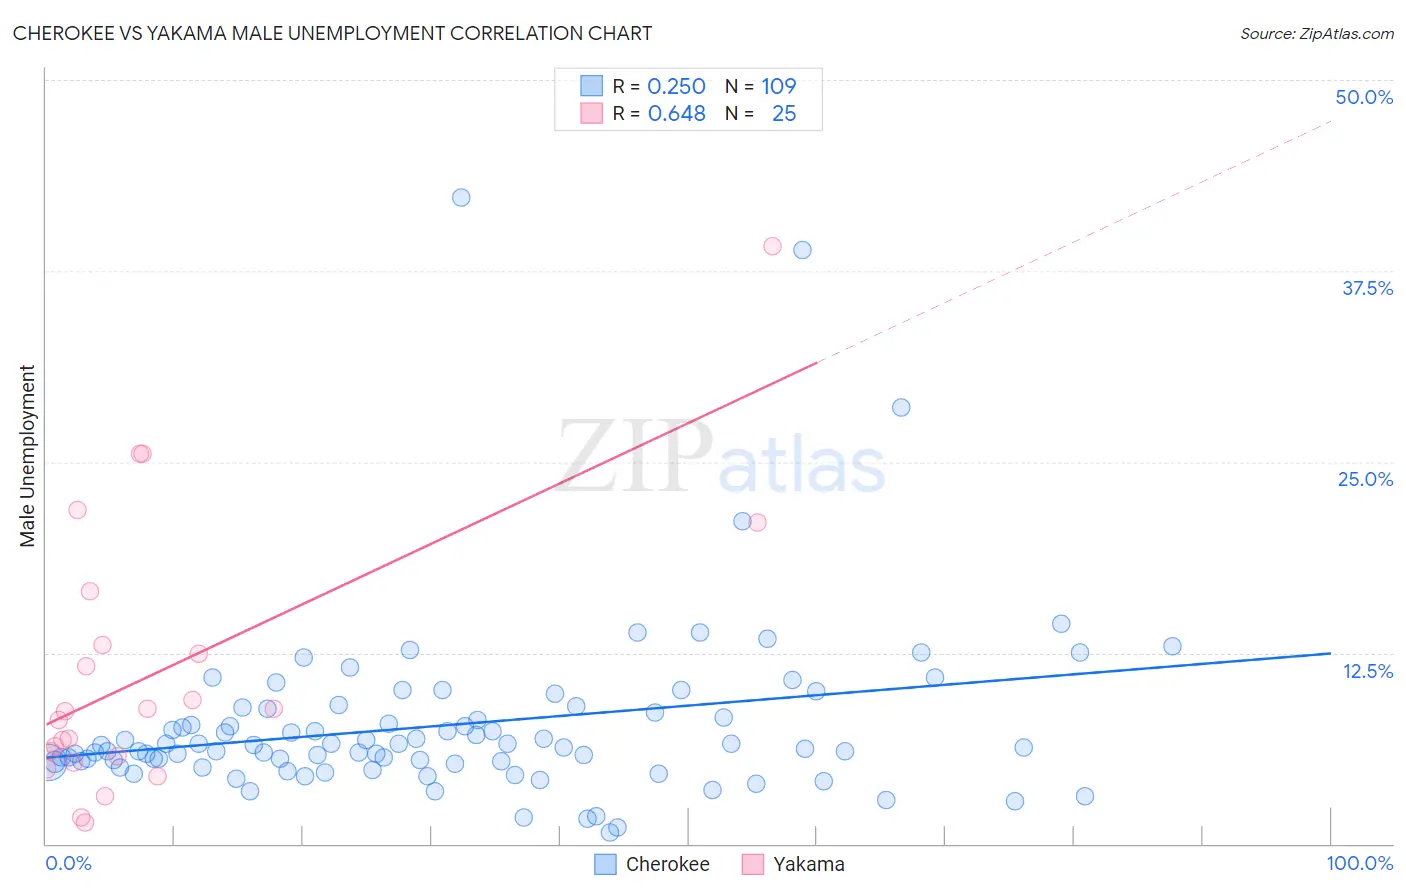
Cherokee vs Yakama Male Unemployment Correlation Chart
The statistical analysis conducted on geographies consisting of 488,550,213 people shows a weak positive correlation between the proportion of Cherokee and unemployment rate among males in the United States with a correlation coefficient (R) of 0.250 and weighted average of 5.6%. Similarly, the statistical analysis conducted on geographies consisting of 19,892,932 people shows a significant positive correlation between the proportion of Yakama and unemployment rate among males in the United States with a correlation coefficient (R) of 0.648 and weighted average of 7.9%, a difference of 42.1%.
Male Unemployment Correlation Summary
| Measurement | Cherokee | Yakama |
| Minimum | 0.70% | 1.4% |
| Maximum | 42.3% | 39.1% |
| Range | 41.6% | 37.7% |
| Mean | 7.8% | 11.3% |
| Median | 6.3% | 8.7% |
| Interquartile 25% (IQ1) | 5.3% | 5.5% |
| Interquartile 75% (IQ3) | 8.7% | 14.7% |
| Interquartile Range (IQR) | 3.4% | 9.2% |
| Standard Deviation (Sample) | 5.9% | 9.0% |
| Standard Deviation (Population) | 5.9% | 8.8% |
Similar Demographics by Male Unemployment
Demographics Similar to Cherokee by Male Unemployment
In terms of male unemployment, the demographic groups most similar to Cherokee are Creek (5.6%, a difference of 0.13%), Immigrants from Micronesia (5.6%, a difference of 0.28%), Panamanian (5.6%, a difference of 0.32%), Immigrants from Cambodia (5.6%, a difference of 0.41%), and Immigrants from Panama (5.6%, a difference of 0.41%).
| Demographics | Rating | Rank | Male Unemployment |
| Delaware | 4.2 /100 | #217 | Tragic 5.5% |
| Immigrants | Albania | 3.6 /100 | #218 | Tragic 5.5% |
| Immigrants | Western Asia | 3.5 /100 | #219 | Tragic 5.6% |
| Portuguese | 3.5 /100 | #220 | Tragic 5.6% |
| Soviet Union | 3.2 /100 | #221 | Tragic 5.6% |
| Immigrants | Micronesia | 2.9 /100 | #222 | Tragic 5.6% |
| Creek | 2.6 /100 | #223 | Tragic 5.6% |
| Cherokee | 2.4 /100 | #224 | Tragic 5.6% |
| Panamanians | 1.9 /100 | #225 | Tragic 5.6% |
| Immigrants | Cambodia | 1.8 /100 | #226 | Tragic 5.6% |
| Immigrants | Panama | 1.8 /100 | #227 | Tragic 5.6% |
| Seminole | 1.8 /100 | #228 | Tragic 5.6% |
| Central Americans | 1.8 /100 | #229 | Tragic 5.6% |
| Immigrants | Africa | 1.7 /100 | #230 | Tragic 5.6% |
| Choctaw | 1.6 /100 | #231 | Tragic 5.6% |
Demographics Similar to Yakama by Male Unemployment
In terms of male unemployment, the demographic groups most similar to Yakama are Immigrants from Yemen (7.8%, a difference of 1.8%), Alaska Native (8.1%, a difference of 1.9%), Native/Alaskan (7.7%, a difference of 2.7%), Paiute (7.7%, a difference of 3.1%), and Immigrants from Dominican Republic (7.6%, a difference of 4.2%).
| Demographics | Rating | Rank | Male Unemployment |
| Immigrants | Grenada | 0.0 /100 | #323 | Tragic 7.6% |
| Dominicans | 0.0 /100 | #324 | Tragic 7.6% |
| Shoshone | 0.0 /100 | #325 | Tragic 7.6% |
| Immigrants | Dominican Republic | 0.0 /100 | #326 | Tragic 7.6% |
| Paiute | 0.0 /100 | #327 | Tragic 7.7% |
| Natives/Alaskans | 0.0 /100 | #328 | Tragic 7.7% |
| Immigrants | Yemen | 0.0 /100 | #329 | Tragic 7.8% |
| Yakama | 0.0 /100 | #330 | Tragic 7.9% |
| Alaska Natives | 0.0 /100 | #331 | Tragic 8.1% |
| Pima | 0.0 /100 | #332 | Tragic 8.3% |
| Sioux | 0.0 /100 | #333 | Tragic 8.4% |
| Tsimshian | 0.0 /100 | #334 | Tragic 8.5% |
| Pueblo | 0.0 /100 | #335 | Tragic 8.5% |
| Yuman | 0.0 /100 | #336 | Tragic 8.6% |
| Puerto Ricans | 0.0 /100 | #337 | Tragic 8.6% |