Cherokee vs Estonian Male Unemployment
COMPARE
Cherokee
Estonian
Male Unemployment
Male Unemployment Comparison
Cherokee
Estonians
5.6%
MALE UNEMPLOYMENT
2.4/ 100
METRIC RATING
224th/ 347
METRIC RANK
5.1%
MALE UNEMPLOYMENT
89.0/ 100
METRIC RATING
117th/ 347
METRIC RANK
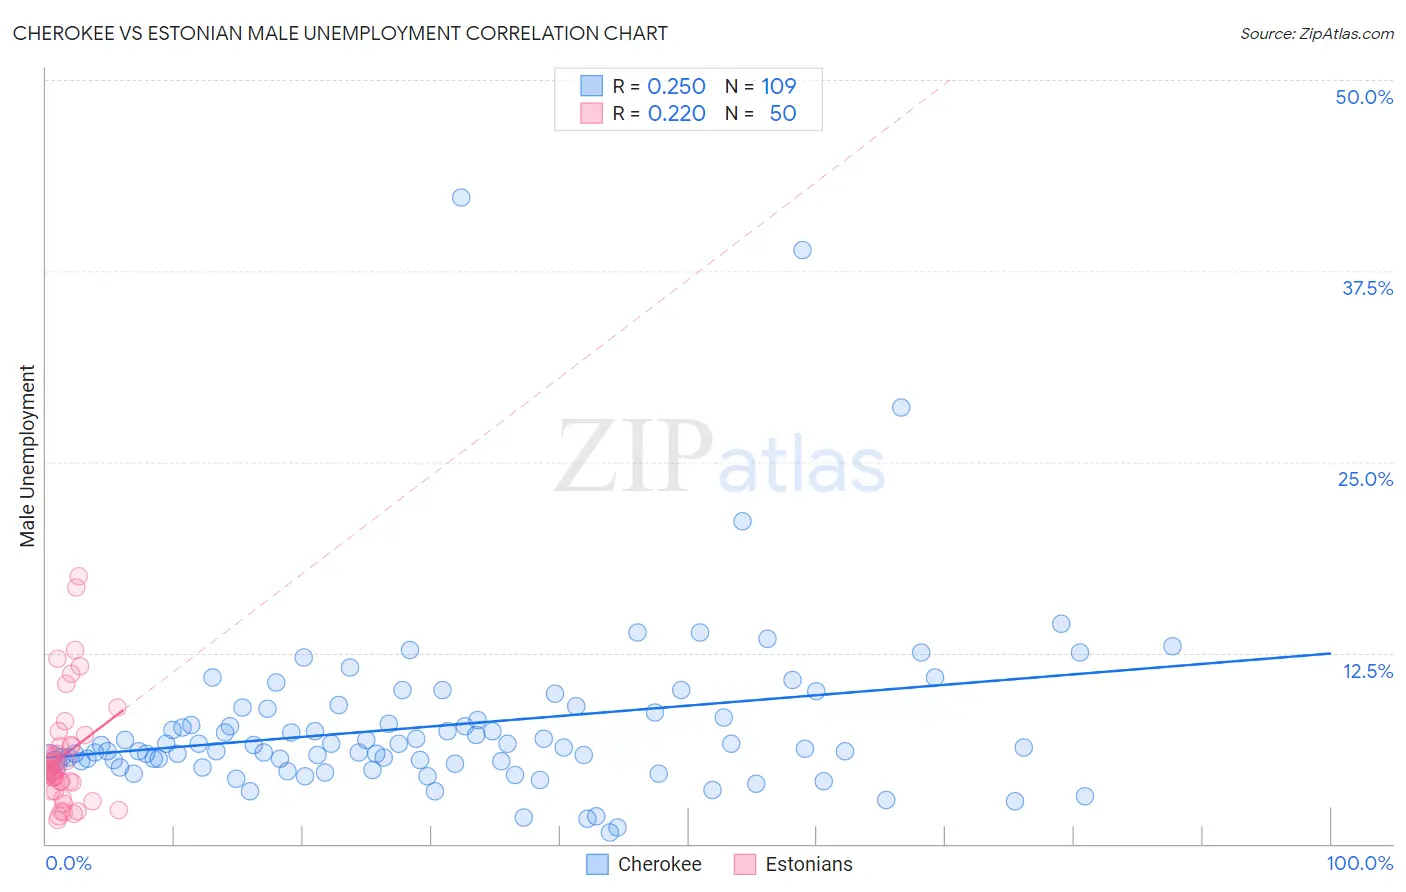
Cherokee vs Estonian Male Unemployment Correlation Chart
The statistical analysis conducted on geographies consisting of 488,550,213 people shows a weak positive correlation between the proportion of Cherokee and unemployment rate among males in the United States with a correlation coefficient (R) of 0.250 and weighted average of 5.6%. Similarly, the statistical analysis conducted on geographies consisting of 123,372,162 people shows a weak positive correlation between the proportion of Estonians and unemployment rate among males in the United States with a correlation coefficient (R) of 0.220 and weighted average of 5.1%, a difference of 8.7%.
Male Unemployment Correlation Summary
| Measurement | Cherokee | Estonian |
| Minimum | 0.70% | 1.5% |
| Maximum | 42.3% | 17.5% |
| Range | 41.6% | 16.0% |
| Mean | 7.8% | 5.8% |
| Median | 6.3% | 4.8% |
| Interquartile 25% (IQ1) | 5.3% | 4.0% |
| Interquartile 75% (IQ3) | 8.7% | 6.4% |
| Interquartile Range (IQR) | 3.4% | 2.4% |
| Standard Deviation (Sample) | 5.9% | 3.6% |
| Standard Deviation (Population) | 5.9% | 3.5% |
Similar Demographics by Male Unemployment
Demographics Similar to Cherokee by Male Unemployment
In terms of male unemployment, the demographic groups most similar to Cherokee are Creek (5.6%, a difference of 0.13%), Immigrants from Micronesia (5.6%, a difference of 0.28%), Panamanian (5.6%, a difference of 0.32%), Immigrants from Cambodia (5.6%, a difference of 0.41%), and Immigrants from Panama (5.6%, a difference of 0.41%).
| Demographics | Rating | Rank | Male Unemployment |
| Delaware | 4.2 /100 | #217 | Tragic 5.5% |
| Immigrants | Albania | 3.6 /100 | #218 | Tragic 5.5% |
| Immigrants | Western Asia | 3.5 /100 | #219 | Tragic 5.6% |
| Portuguese | 3.5 /100 | #220 | Tragic 5.6% |
| Soviet Union | 3.2 /100 | #221 | Tragic 5.6% |
| Immigrants | Micronesia | 2.9 /100 | #222 | Tragic 5.6% |
| Creek | 2.6 /100 | #223 | Tragic 5.6% |
| Cherokee | 2.4 /100 | #224 | Tragic 5.6% |
| Panamanians | 1.9 /100 | #225 | Tragic 5.6% |
| Immigrants | Cambodia | 1.8 /100 | #226 | Tragic 5.6% |
| Immigrants | Panama | 1.8 /100 | #227 | Tragic 5.6% |
| Seminole | 1.8 /100 | #228 | Tragic 5.6% |
| Central Americans | 1.8 /100 | #229 | Tragic 5.6% |
| Immigrants | Africa | 1.7 /100 | #230 | Tragic 5.6% |
| Choctaw | 1.6 /100 | #231 | Tragic 5.6% |
Demographics Similar to Estonians by Male Unemployment
In terms of male unemployment, the demographic groups most similar to Estonians are Cypriot (5.1%, a difference of 0.030%), Immigrants from Denmark (5.1%, a difference of 0.050%), French Canadian (5.1%, a difference of 0.070%), Immigrants from Asia (5.1%, a difference of 0.090%), and Ukrainian (5.1%, a difference of 0.090%).
| Demographics | Rating | Rank | Male Unemployment |
| Immigrants | England | 90.8 /100 | #110 | Exceptional 5.1% |
| Immigrants | Eastern Asia | 90.8 /100 | #111 | Exceptional 5.1% |
| Immigrants | Moldova | 90.3 /100 | #112 | Exceptional 5.1% |
| Immigrants | Austria | 90.3 /100 | #113 | Exceptional 5.1% |
| Romanians | 89.8 /100 | #114 | Excellent 5.1% |
| Immigrants | Asia | 89.6 /100 | #115 | Excellent 5.1% |
| Immigrants | Denmark | 89.4 /100 | #116 | Excellent 5.1% |
| Estonians | 89.0 /100 | #117 | Excellent 5.1% |
| Cypriots | 88.8 /100 | #118 | Excellent 5.1% |
| French Canadians | 88.6 /100 | #119 | Excellent 5.1% |
| Ukrainians | 88.4 /100 | #120 | Excellent 5.1% |
| Mongolians | 88.4 /100 | #121 | Excellent 5.1% |
| Nicaraguans | 88.2 /100 | #122 | Excellent 5.1% |
| Palestinians | 87.7 /100 | #123 | Excellent 5.1% |
| Immigrants | Latvia | 87.5 /100 | #124 | Excellent 5.1% |