Cambodian vs Immigrants from Netherlands Female Unemployment
COMPARE
Cambodian
Immigrants from Netherlands
Female Unemployment
Female Unemployment Comparison
Cambodians
Immigrants from Netherlands
4.9%
FEMALE UNEMPLOYMENT
99.1/ 100
METRIC RATING
51st/ 347
METRIC RANK
5.0%
FEMALE UNEMPLOYMENT
97.8/ 100
METRIC RATING
78th/ 347
METRIC RANK
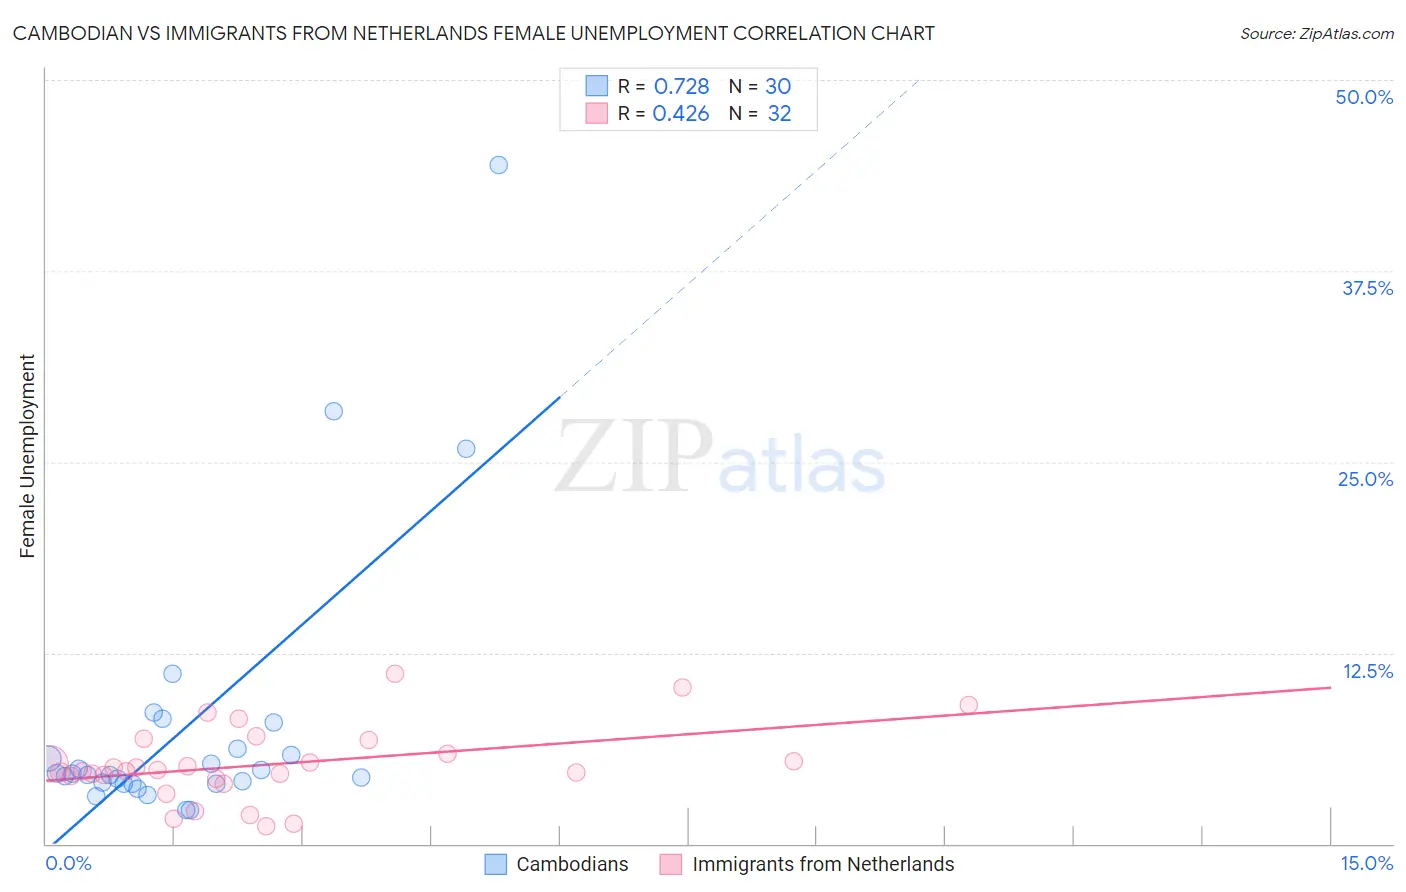
Cambodian vs Immigrants from Netherlands Female Unemployment Correlation Chart
The statistical analysis conducted on geographies consisting of 102,438,454 people shows a strong positive correlation between the proportion of Cambodians and unemploymnet rate among females in the United States with a correlation coefficient (R) of 0.728 and weighted average of 4.9%. Similarly, the statistical analysis conducted on geographies consisting of 237,125,714 people shows a moderate positive correlation between the proportion of Immigrants from Netherlands and unemploymnet rate among females in the United States with a correlation coefficient (R) of 0.426 and weighted average of 5.0%, a difference of 1.4%.
Female Unemployment Correlation Summary
| Measurement | Cambodian | Immigrants from Netherlands |
| Minimum | 2.2% | 1.2% |
| Maximum | 44.4% | 11.1% |
| Range | 42.2% | 9.9% |
| Mean | 7.7% | 5.2% |
| Median | 4.5% | 4.8% |
| Interquartile 25% (IQ1) | 4.0% | 4.4% |
| Interquartile 75% (IQ3) | 6.2% | 6.4% |
| Interquartile Range (IQR) | 2.2% | 2.0% |
| Standard Deviation (Sample) | 9.1% | 2.4% |
| Standard Deviation (Population) | 9.0% | 2.4% |
Similar Demographics by Female Unemployment
Demographics Similar to Cambodians by Female Unemployment
In terms of female unemployment, the demographic groups most similar to Cambodians are Immigrants from Cuba (4.9%, a difference of 0.020%), Slavic (4.9%, a difference of 0.020%), White/Caucasian (4.9%, a difference of 0.050%), Immigrants from Zimbabwe (4.9%, a difference of 0.11%), and Immigrants from Moldova (4.9%, a difference of 0.12%).
| Demographics | Rating | Rank | Female Unemployment |
| Greeks | 99.4 /100 | #44 | Exceptional 4.9% |
| Austrians | 99.3 /100 | #45 | Exceptional 4.9% |
| Immigrants | Bulgaria | 99.3 /100 | #46 | Exceptional 4.9% |
| Okinawans | 99.3 /100 | #47 | Exceptional 4.9% |
| Thais | 99.2 /100 | #48 | Exceptional 4.9% |
| Australians | 99.2 /100 | #49 | Exceptional 4.9% |
| Immigrants | Cuba | 99.1 /100 | #50 | Exceptional 4.9% |
| Cambodians | 99.1 /100 | #51 | Exceptional 4.9% |
| Slavs | 99.1 /100 | #52 | Exceptional 4.9% |
| Whites/Caucasians | 99.0 /100 | #53 | Exceptional 4.9% |
| Immigrants | Zimbabwe | 99.0 /100 | #54 | Exceptional 4.9% |
| Immigrants | Moldova | 99.0 /100 | #55 | Exceptional 4.9% |
| Serbians | 99.0 /100 | #56 | Exceptional 4.9% |
| Icelanders | 98.8 /100 | #57 | Exceptional 4.9% |
| Immigrants | Lithuania | 98.8 /100 | #58 | Exceptional 4.9% |
Demographics Similar to Immigrants from Netherlands by Female Unemployment
In terms of female unemployment, the demographic groups most similar to Immigrants from Netherlands are Mongolian (5.0%, a difference of 0.0%), Immigrants from Venezuela (5.0%, a difference of 0.090%), Immigrants from Singapore (5.0%, a difference of 0.10%), Immigrants from Bolivia (5.0%, a difference of 0.12%), and Russian (5.0%, a difference of 0.13%).
| Demographics | Rating | Rank | Female Unemployment |
| German Russians | 98.1 /100 | #71 | Exceptional 4.9% |
| Immigrants | Northern Europe | 98.0 /100 | #72 | Exceptional 4.9% |
| Russians | 98.0 /100 | #73 | Exceptional 5.0% |
| Immigrants | Bolivia | 98.0 /100 | #74 | Exceptional 5.0% |
| Immigrants | Singapore | 98.0 /100 | #75 | Exceptional 5.0% |
| Immigrants | Venezuela | 97.9 /100 | #76 | Exceptional 5.0% |
| Mongolians | 97.8 /100 | #77 | Exceptional 5.0% |
| Immigrants | Netherlands | 97.8 /100 | #78 | Exceptional 5.0% |
| Turks | 97.6 /100 | #79 | Exceptional 5.0% |
| New Zealanders | 97.4 /100 | #80 | Exceptional 5.0% |
| Filipinos | 97.3 /100 | #81 | Exceptional 5.0% |
| Immigrants | Australia | 97.3 /100 | #82 | Exceptional 5.0% |
| Immigrants | Serbia | 97.2 /100 | #83 | Exceptional 5.0% |
| Canadians | 97.2 /100 | #84 | Exceptional 5.0% |
| Ukrainians | 97.1 /100 | #85 | Exceptional 5.0% |