Scottish vs Immigrants from Portugal Female Unemployment
COMPARE
Scottish
Immigrants from Portugal
Female Unemployment
Female Unemployment Comparison
Scottish
Immigrants from Portugal
4.7%
FEMALE UNEMPLOYMENT
99.9/ 100
METRIC RATING
23rd/ 347
METRIC RANK
5.8%
FEMALE UNEMPLOYMENT
0.2/ 100
METRIC RATING
258th/ 347
METRIC RANK
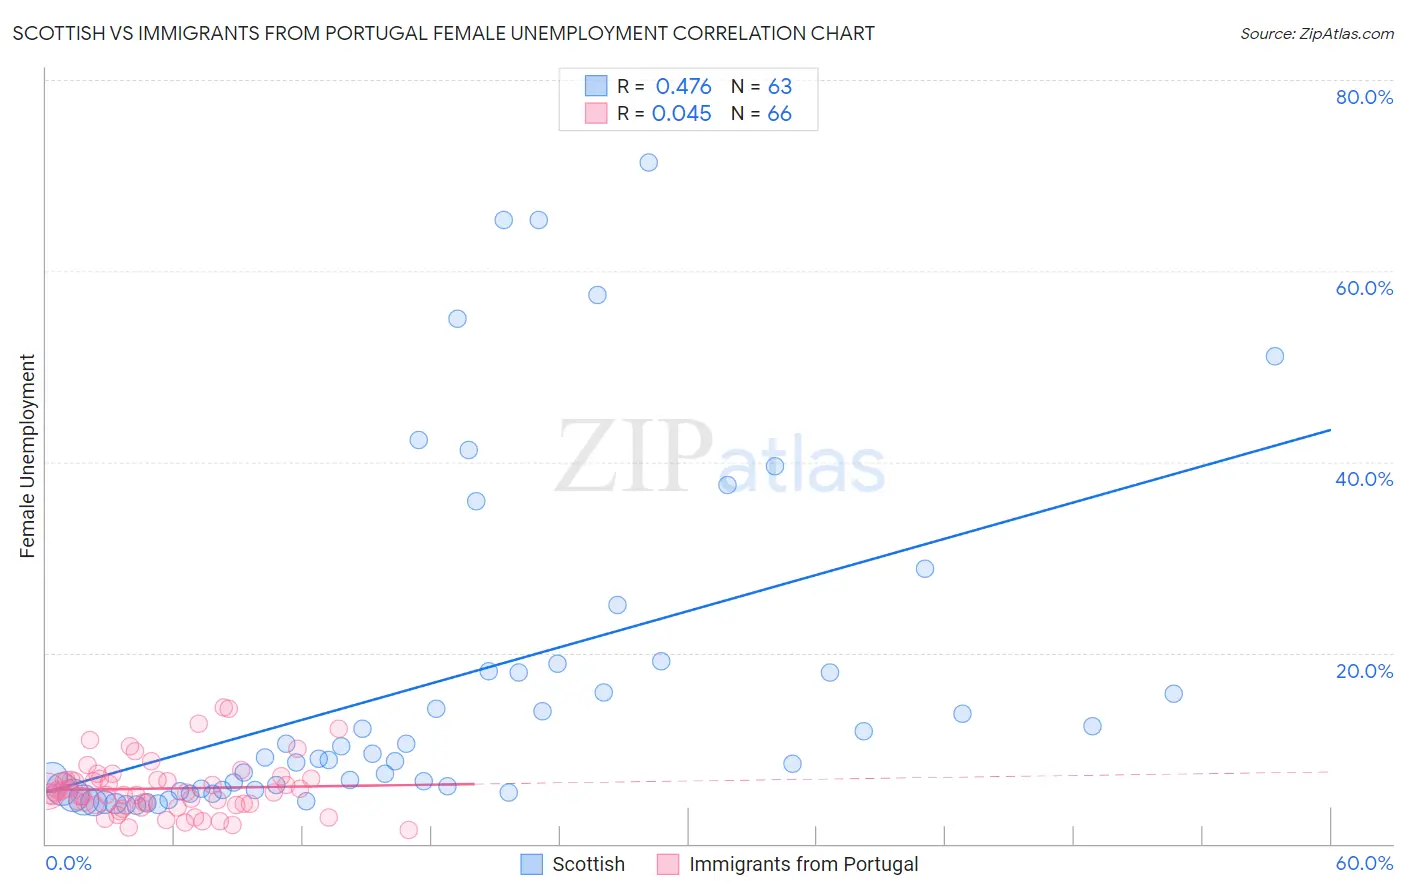
Scottish vs Immigrants from Portugal Female Unemployment Correlation Chart
The statistical analysis conducted on geographies consisting of 553,178,597 people shows a moderate positive correlation between the proportion of Scottish and unemploymnet rate among females in the United States with a correlation coefficient (R) of 0.476 and weighted average of 4.7%. Similarly, the statistical analysis conducted on geographies consisting of 174,363,409 people shows no correlation between the proportion of Immigrants from Portugal and unemploymnet rate among females in the United States with a correlation coefficient (R) of 0.045 and weighted average of 5.8%, a difference of 22.0%.
Female Unemployment Correlation Summary
| Measurement | Scottish | Immigrants from Portugal |
| Minimum | 4.1% | 1.5% |
| Maximum | 71.4% | 14.3% |
| Range | 67.3% | 12.8% |
| Mean | 16.8% | 5.8% |
| Median | 8.9% | 5.4% |
| Interquartile 25% (IQ1) | 5.6% | 4.1% |
| Interquartile 75% (IQ3) | 18.0% | 6.7% |
| Interquartile Range (IQR) | 12.5% | 2.7% |
| Standard Deviation (Sample) | 17.5% | 2.8% |
| Standard Deviation (Population) | 17.4% | 2.8% |
Similar Demographics by Female Unemployment
Demographics Similar to Scottish by Female Unemployment
In terms of female unemployment, the demographic groups most similar to Scottish are Welsh (4.7%, a difference of 0.21%), Immigrants from India (4.7%, a difference of 0.29%), Immigrants from Bosnia and Herzegovina (4.7%, a difference of 0.33%), British (4.7%, a difference of 0.50%), and Irish (4.7%, a difference of 0.53%).
| Demographics | Rating | Rank | Female Unemployment |
| Carpatho Rusyns | 99.9 /100 | #16 | Exceptional 4.7% |
| Croatians | 99.9 /100 | #17 | Exceptional 4.7% |
| Latvians | 99.9 /100 | #18 | Exceptional 4.7% |
| Poles | 99.9 /100 | #19 | Exceptional 4.7% |
| Bulgarians | 99.9 /100 | #20 | Exceptional 4.7% |
| Fijians | 99.9 /100 | #21 | Exceptional 4.7% |
| Europeans | 99.9 /100 | #22 | Exceptional 4.7% |
| Scottish | 99.9 /100 | #23 | Exceptional 4.7% |
| Welsh | 99.9 /100 | #24 | Exceptional 4.7% |
| Immigrants | India | 99.9 /100 | #25 | Exceptional 4.7% |
| Immigrants | Bosnia and Herzegovina | 99.9 /100 | #26 | Exceptional 4.7% |
| British | 99.9 /100 | #27 | Exceptional 4.7% |
| Irish | 99.9 /100 | #28 | Exceptional 4.7% |
| Cypriots | 99.9 /100 | #29 | Exceptional 4.7% |
| Lithuanians | 99.8 /100 | #30 | Exceptional 4.7% |
Demographics Similar to Immigrants from Portugal by Female Unemployment
In terms of female unemployment, the demographic groups most similar to Immigrants from Portugal are Immigrants from Fiji (5.8%, a difference of 0.11%), Nigerian (5.8%, a difference of 0.14%), Kiowa (5.8%, a difference of 0.41%), Immigrants from Nigeria (5.8%, a difference of 0.44%), and Dutch West Indian (5.7%, a difference of 0.81%).
| Demographics | Rating | Rank | Female Unemployment |
| Assyrians/Chaldeans/Syriacs | 0.8 /100 | #251 | Tragic 5.6% |
| Cajuns | 0.7 /100 | #252 | Tragic 5.7% |
| Immigrants | Sierra Leone | 0.6 /100 | #253 | Tragic 5.7% |
| Immigrants | Immigrants | 0.6 /100 | #254 | Tragic 5.7% |
| Immigrants | Cameroon | 0.6 /100 | #255 | Tragic 5.7% |
| Sub-Saharan Africans | 0.4 /100 | #256 | Tragic 5.7% |
| Dutch West Indians | 0.3 /100 | #257 | Tragic 5.7% |
| Immigrants | Portugal | 0.2 /100 | #258 | Tragic 5.8% |
| Immigrants | Fiji | 0.2 /100 | #259 | Tragic 5.8% |
| Nigerians | 0.2 /100 | #260 | Tragic 5.8% |
| Kiowa | 0.1 /100 | #261 | Tragic 5.8% |
| Immigrants | Nigeria | 0.1 /100 | #262 | Tragic 5.8% |
| Immigrants | Azores | 0.1 /100 | #263 | Tragic 5.8% |
| Immigrants | Bahamas | 0.1 /100 | #264 | Tragic 5.8% |
| Blackfeet | 0.0 /100 | #265 | Tragic 5.9% |