Brazilian vs Immigrants from Portugal Female Unemployment
COMPARE
Brazilian
Immigrants from Portugal
Female Unemployment
Female Unemployment Comparison
Brazilians
Immigrants from Portugal
5.5%
FEMALE UNEMPLOYMENT
7.3/ 100
METRIC RATING
221st/ 347
METRIC RANK
5.8%
FEMALE UNEMPLOYMENT
0.2/ 100
METRIC RATING
258th/ 347
METRIC RANK
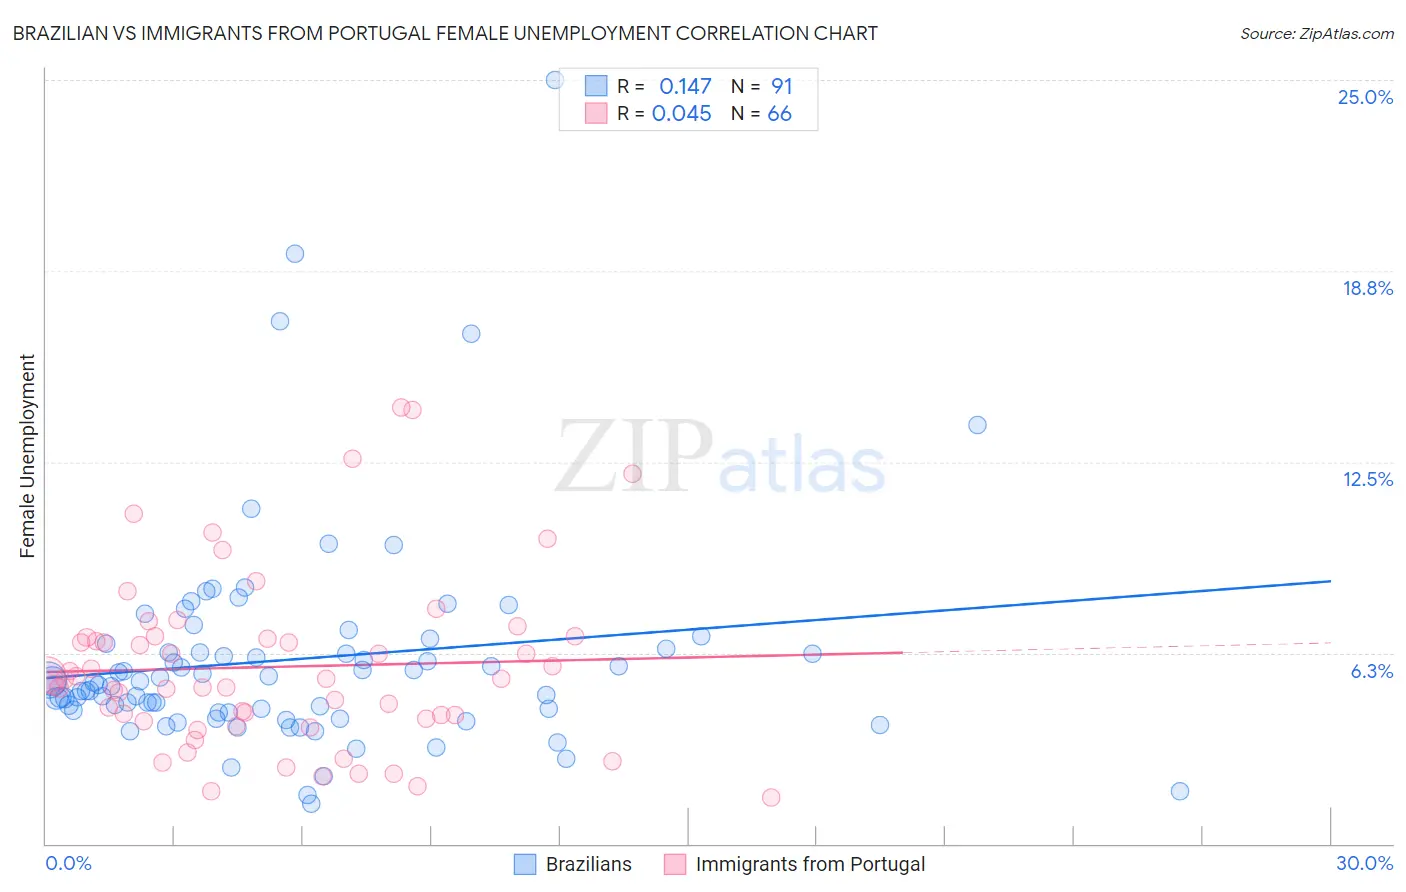
Brazilian vs Immigrants from Portugal Female Unemployment Correlation Chart
The statistical analysis conducted on geographies consisting of 323,090,102 people shows a poor positive correlation between the proportion of Brazilians and unemploymnet rate among females in the United States with a correlation coefficient (R) of 0.147 and weighted average of 5.5%. Similarly, the statistical analysis conducted on geographies consisting of 174,363,409 people shows no correlation between the proportion of Immigrants from Portugal and unemploymnet rate among females in the United States with a correlation coefficient (R) of 0.045 and weighted average of 5.8%, a difference of 5.4%.
Female Unemployment Correlation Summary
| Measurement | Brazilian | Immigrants from Portugal |
| Minimum | 1.3% | 1.5% |
| Maximum | 25.0% | 14.3% |
| Range | 23.7% | 12.8% |
| Mean | 6.0% | 5.8% |
| Median | 5.3% | 5.4% |
| Interquartile 25% (IQ1) | 4.3% | 4.1% |
| Interquartile 75% (IQ3) | 6.4% | 6.7% |
| Interquartile Range (IQR) | 2.1% | 2.7% |
| Standard Deviation (Sample) | 3.6% | 2.8% |
| Standard Deviation (Population) | 3.6% | 2.8% |
Similar Demographics by Female Unemployment
Demographics Similar to Brazilians by Female Unemployment
In terms of female unemployment, the demographic groups most similar to Brazilians are Nicaraguan (5.5%, a difference of 0.020%), Delaware (5.5%, a difference of 0.030%), Iraqi (5.5%, a difference of 0.060%), Immigrants from Africa (5.4%, a difference of 0.25%), and South American (5.4%, a difference of 0.26%).
| Demographics | Rating | Rank | Female Unemployment |
| Seminole | 10.3 /100 | #214 | Poor 5.4% |
| Immigrants | Nicaragua | 10.2 /100 | #215 | Poor 5.4% |
| Comanche | 10.0 /100 | #216 | Poor 5.4% |
| Peruvians | 9.6 /100 | #217 | Tragic 5.4% |
| Bermudans | 9.0 /100 | #218 | Tragic 5.4% |
| South Americans | 8.6 /100 | #219 | Tragic 5.4% |
| Immigrants | Africa | 8.5 /100 | #220 | Tragic 5.4% |
| Brazilians | 7.3 /100 | #221 | Tragic 5.5% |
| Nicaraguans | 7.2 /100 | #222 | Tragic 5.5% |
| Delaware | 7.2 /100 | #223 | Tragic 5.5% |
| Iraqis | 7.1 /100 | #224 | Tragic 5.5% |
| French American Indians | 6.1 /100 | #225 | Tragic 5.5% |
| Immigrants | Peru | 5.9 /100 | #226 | Tragic 5.5% |
| Immigrants | Philippines | 5.3 /100 | #227 | Tragic 5.5% |
| Israelis | 4.8 /100 | #228 | Tragic 5.5% |
Demographics Similar to Immigrants from Portugal by Female Unemployment
In terms of female unemployment, the demographic groups most similar to Immigrants from Portugal are Immigrants from Fiji (5.8%, a difference of 0.11%), Nigerian (5.8%, a difference of 0.14%), Kiowa (5.8%, a difference of 0.41%), Immigrants from Nigeria (5.8%, a difference of 0.44%), and Dutch West Indian (5.7%, a difference of 0.81%).
| Demographics | Rating | Rank | Female Unemployment |
| Assyrians/Chaldeans/Syriacs | 0.8 /100 | #251 | Tragic 5.6% |
| Cajuns | 0.7 /100 | #252 | Tragic 5.7% |
| Immigrants | Sierra Leone | 0.6 /100 | #253 | Tragic 5.7% |
| Immigrants | Immigrants | 0.6 /100 | #254 | Tragic 5.7% |
| Immigrants | Cameroon | 0.6 /100 | #255 | Tragic 5.7% |
| Sub-Saharan Africans | 0.4 /100 | #256 | Tragic 5.7% |
| Dutch West Indians | 0.3 /100 | #257 | Tragic 5.7% |
| Immigrants | Portugal | 0.2 /100 | #258 | Tragic 5.8% |
| Immigrants | Fiji | 0.2 /100 | #259 | Tragic 5.8% |
| Nigerians | 0.2 /100 | #260 | Tragic 5.8% |
| Kiowa | 0.1 /100 | #261 | Tragic 5.8% |
| Immigrants | Nigeria | 0.1 /100 | #262 | Tragic 5.8% |
| Immigrants | Azores | 0.1 /100 | #263 | Tragic 5.8% |
| Immigrants | Bahamas | 0.1 /100 | #264 | Tragic 5.8% |
| Blackfeet | 0.0 /100 | #265 | Tragic 5.9% |