Cambodian vs Colombian Female Unemployment
COMPARE
Cambodian
Colombian
Female Unemployment
Female Unemployment Comparison
Cambodians
Colombians
4.9%
FEMALE UNEMPLOYMENT
99.1/ 100
METRIC RATING
51st/ 347
METRIC RANK
5.3%
FEMALE UNEMPLOYMENT
27.0/ 100
METRIC RATING
194th/ 347
METRIC RANK
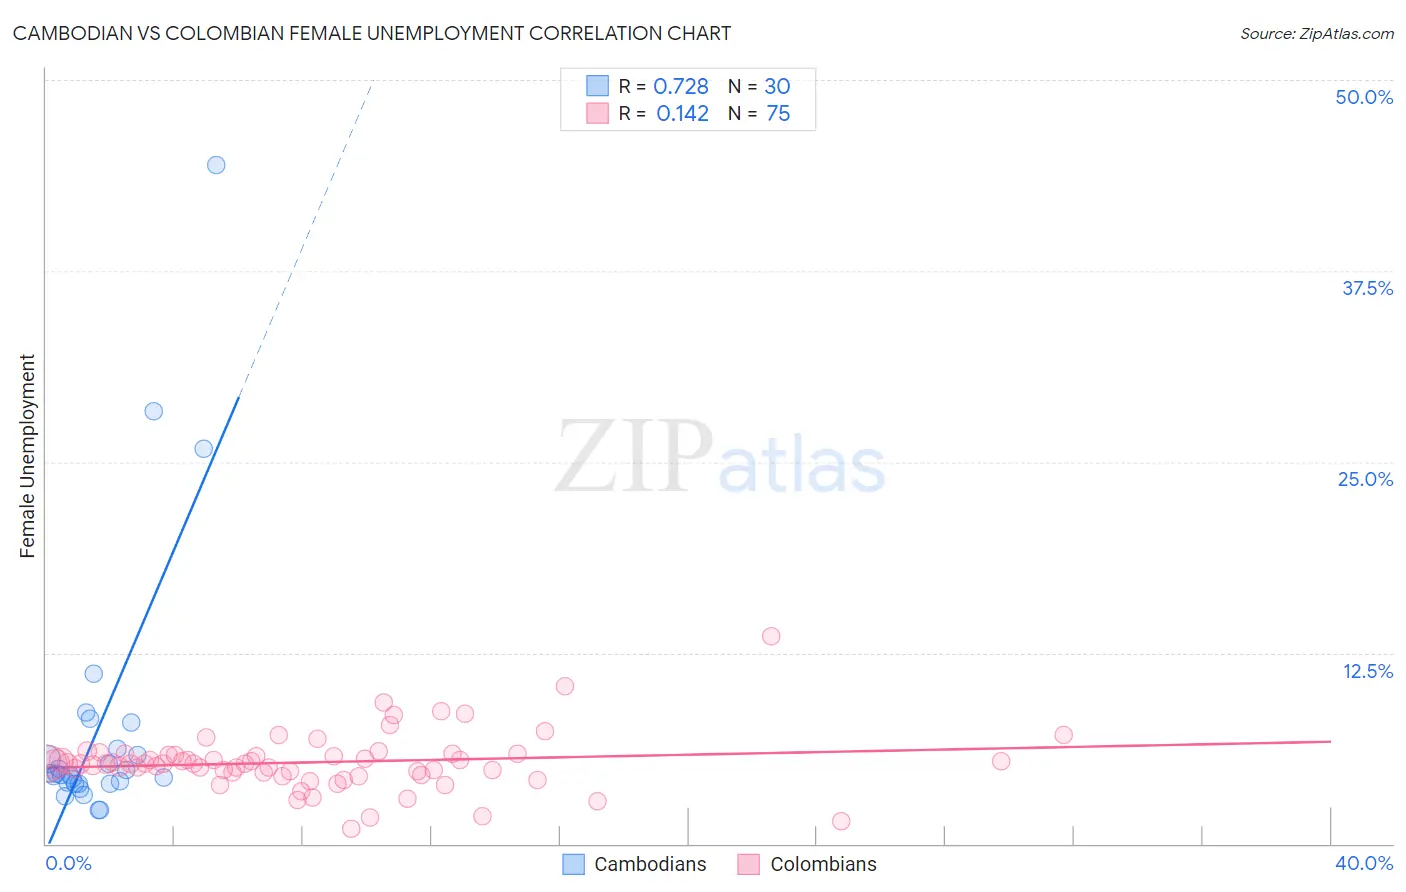
Cambodian vs Colombian Female Unemployment Correlation Chart
The statistical analysis conducted on geographies consisting of 102,438,454 people shows a strong positive correlation between the proportion of Cambodians and unemploymnet rate among females in the United States with a correlation coefficient (R) of 0.728 and weighted average of 4.9%. Similarly, the statistical analysis conducted on geographies consisting of 417,884,400 people shows a poor positive correlation between the proportion of Colombians and unemploymnet rate among females in the United States with a correlation coefficient (R) of 0.142 and weighted average of 5.3%, a difference of 9.1%.
Female Unemployment Correlation Summary
| Measurement | Cambodian | Colombian |
| Minimum | 2.2% | 1.0% |
| Maximum | 44.4% | 13.6% |
| Range | 42.2% | 12.6% |
| Mean | 7.7% | 5.3% |
| Median | 4.5% | 5.2% |
| Interquartile 25% (IQ1) | 4.0% | 4.7% |
| Interquartile 75% (IQ3) | 6.2% | 5.8% |
| Interquartile Range (IQR) | 2.2% | 1.2% |
| Standard Deviation (Sample) | 9.1% | 1.9% |
| Standard Deviation (Population) | 9.0% | 1.9% |
Similar Demographics by Female Unemployment
Demographics Similar to Cambodians by Female Unemployment
In terms of female unemployment, the demographic groups most similar to Cambodians are Immigrants from Cuba (4.9%, a difference of 0.020%), Slavic (4.9%, a difference of 0.020%), White/Caucasian (4.9%, a difference of 0.050%), Immigrants from Zimbabwe (4.9%, a difference of 0.11%), and Immigrants from Moldova (4.9%, a difference of 0.12%).
| Demographics | Rating | Rank | Female Unemployment |
| Greeks | 99.4 /100 | #44 | Exceptional 4.9% |
| Austrians | 99.3 /100 | #45 | Exceptional 4.9% |
| Immigrants | Bulgaria | 99.3 /100 | #46 | Exceptional 4.9% |
| Okinawans | 99.3 /100 | #47 | Exceptional 4.9% |
| Thais | 99.2 /100 | #48 | Exceptional 4.9% |
| Australians | 99.2 /100 | #49 | Exceptional 4.9% |
| Immigrants | Cuba | 99.1 /100 | #50 | Exceptional 4.9% |
| Cambodians | 99.1 /100 | #51 | Exceptional 4.9% |
| Slavs | 99.1 /100 | #52 | Exceptional 4.9% |
| Whites/Caucasians | 99.0 /100 | #53 | Exceptional 4.9% |
| Immigrants | Zimbabwe | 99.0 /100 | #54 | Exceptional 4.9% |
| Immigrants | Moldova | 99.0 /100 | #55 | Exceptional 4.9% |
| Serbians | 99.0 /100 | #56 | Exceptional 4.9% |
| Icelanders | 98.8 /100 | #57 | Exceptional 4.9% |
| Immigrants | Lithuania | 98.8 /100 | #58 | Exceptional 4.9% |
Demographics Similar to Colombians by Female Unemployment
In terms of female unemployment, the demographic groups most similar to Colombians are Arab (5.3%, a difference of 0.050%), Immigrants from Colombia (5.3%, a difference of 0.060%), Portuguese (5.3%, a difference of 0.12%), Spaniard (5.3%, a difference of 0.14%), and Alsatian (5.3%, a difference of 0.24%).
| Demographics | Rating | Rank | Female Unemployment |
| Immigrants | Albania | 35.4 /100 | #187 | Fair 5.3% |
| Afghans | 33.9 /100 | #188 | Fair 5.3% |
| Costa Ricans | 33.8 /100 | #189 | Fair 5.3% |
| Ugandans | 31.2 /100 | #190 | Fair 5.3% |
| Cherokee | 30.8 /100 | #191 | Fair 5.3% |
| Portuguese | 28.6 /100 | #192 | Fair 5.3% |
| Arabs | 27.7 /100 | #193 | Fair 5.3% |
| Colombians | 27.0 /100 | #194 | Fair 5.3% |
| Immigrants | Colombia | 26.2 /100 | #195 | Fair 5.3% |
| Spaniards | 25.2 /100 | #196 | Fair 5.3% |
| Alsatians | 23.9 /100 | #197 | Fair 5.3% |
| Tsimshian | 23.1 /100 | #198 | Fair 5.4% |
| Hawaiians | 22.2 /100 | #199 | Fair 5.4% |
| Soviet Union | 21.7 /100 | #200 | Fair 5.4% |
| Immigrants | Middle Africa | 20.8 /100 | #201 | Fair 5.4% |